Investments and Funding
Asset Allocation
Set out below is the scheme-level asset allocation based on the more granular asset classifications as at 31 March 2025, together with the respective weightings of these asset classes in total net assets.
| (£m) | 24-25 | Percent of total | 23-24 | Percent of total |
|---|---|---|---|---|
| Equities | 194,833.58 | 48% | 192,602.31 | 49% |
| Bonds | 65,866.94 | 16% | 61,790.12 | 16% |
| Property | 32,719.75 | 8% | 28,998.53 | 7% |
| Infrastructure | 25,736.96 | 6% | 23,715.61 | 6% |
| Private Equity | 24,346.97 | 6% | 23,717.54 | 6% |
| Multi-asset credit | 8,011.54 | 2% | 5,959.17 | 2% |
| Private debt | 12,400.63 | 3% | 10,906.30 | 3% |
| Diversified Growth Funds (DGF) | 8,132.06 | 2% | 6,738.70 | 2% |
| Liability Driven Investments (LDI) | 668.86 | 0% | 2,246.25 | 1% |
| Hedge funds | 1,357.29 | 0% | 1,414.49 | 0% |
| Derivatives | 127.10 | 116.797 | ||
| Cash | 9,520.11 | 8,350.80 | ||
| Other balances | 16,760.29 | 13,745.18 | ||
| Total closing net assets | 402,422.39 | 389,963.06 |
Progress with Pooling
In their Annual Reports, funds were required to provide data on how far they had implemented the Government’s policy on pooling their assets in their chosen LGPS pool by the end of the year. Only 70 out of 87 funds included this table within their annual reports. This data is summarised in the table below:
| Pool | Included in data | Total value of included partner fund assets | Pooled | Under pool management | Not pooled |
|---|---|---|---|---|---|
| Access | 10 | 60,435.631 | 50% | 25% | 25% |
| Border to Coast | 11 | 65,593.757 | 56% | 15% | 24% |
| Brunel | 9 | 37,473.901 | 80% | 7% | 12% |
| LCIV | 20 | 33,826.759 | 35% | 28% | 33% |
| LGPS Central | 8 | 63,123.646 | 36% | 23% | 27% |
| LPPI | 3 | 23,183.743 | 95% | 5% | 0% |
| Northern | 3 | 63,224.832 | 6% | 92% | 2% |
| WPP | 6 | 17,651.043 | 54% | 20% | 25% |
| Total | 70 | 364,513.312 | 46% | 31% | 19% |
Investment in the UK
For the first time in 2023/24, funds were asked by Government to set out the amounts which they allocated to UK listed equity, UK Government bonds, UK infrastructure and UK private equity in a supplementary table, including through the pools. For these purposes, UK listed means amounts invested in equities listed on a recognised UK exchange (irrespective of the underlying operations of the company). The table below summarises the data reported*
| £m Asset values as at 31 March 2025 | Pooled | Under Pool Management | Not Pooled | Total | Per cent of total LGPS assets |
| UK Listed Equities | 11,894 | 13,929 | 1,371 | 27,194 | |
| UK Government Bonds | 4,817 | 16,421 | 2,465 | 23,561 | |
| UK Infrastructure | 5,642 | 1,503 | 5,065 | 11,730 | |
| UK Private Equity | 1,927 | 1,994 | 2,221 | 6,131 | |
| 68,616 | 17% |
*This table only includes data from the 67 out of 87 pension funds who included this table in their annual reports.
PIRC Study of Investment Performance
The following market commentary is taken from analysis that has been provided by Pensions & Investment Research Consultants Ltd (PIRC) in their annual review. It is based on analysis of a ‘Universe’ of 62 funds in England and Wales plus one Scottish fund (Strathclyde). These funds represent some two thirds of local authority pension fund assets and include all 8 of the Wales Pensions Partnership, all in LPPI and the 3 Northern LGPS funds, all bar one of the London CIV funds, with funds from all other pools except LGPS Central.
Over the long-term funds have delivered an average return of 8% pa. The returns will be impacted by global political and economic factors and so are not delivered consistently.
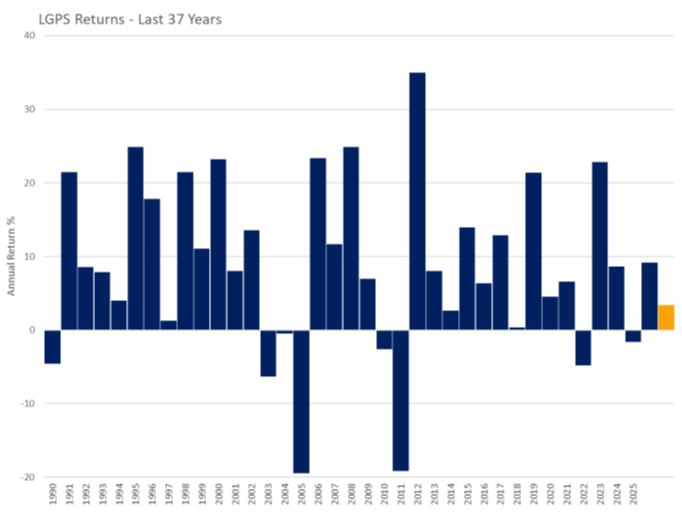
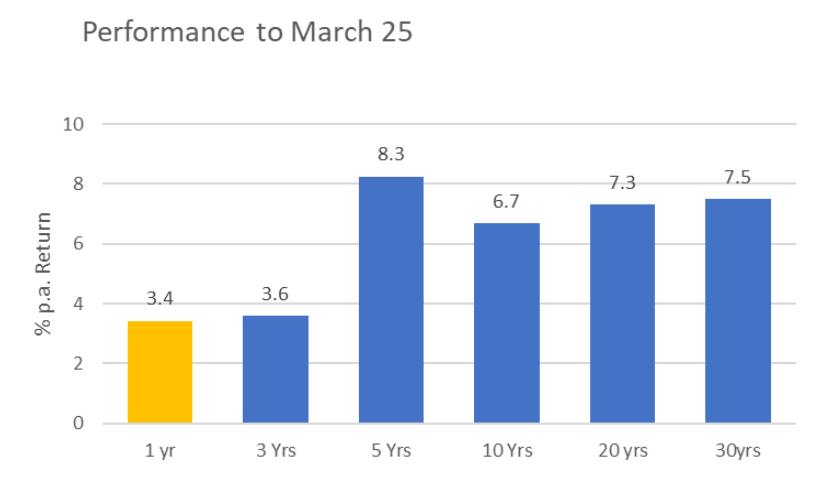
The average fund delivered a return of 3.4% in the latest year. All funds failed to achieve benchmark performance. Longer term results remain well ahead of inflation and funds’ actuarial assumptions.
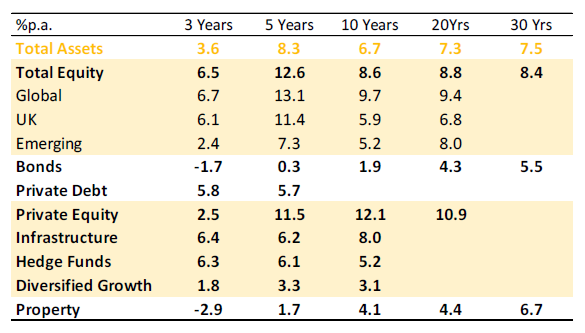
The best results over the longer term have been delivered by equities. Bonds have had a dramatic drag on performance for most funds. The low returns available from government issues has prompted a sizeable shift into private debt. Infrastructure has had a positive impact on most funds’ overall performance.
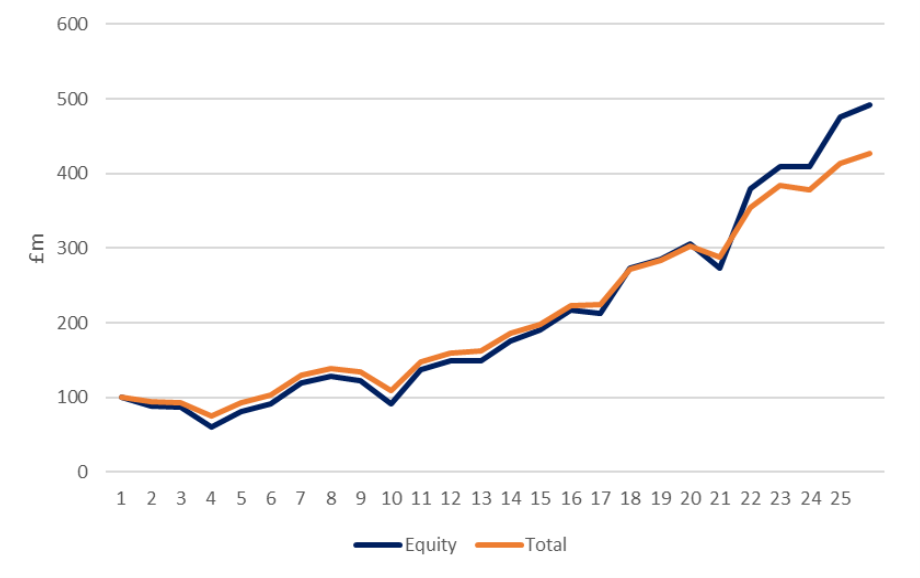
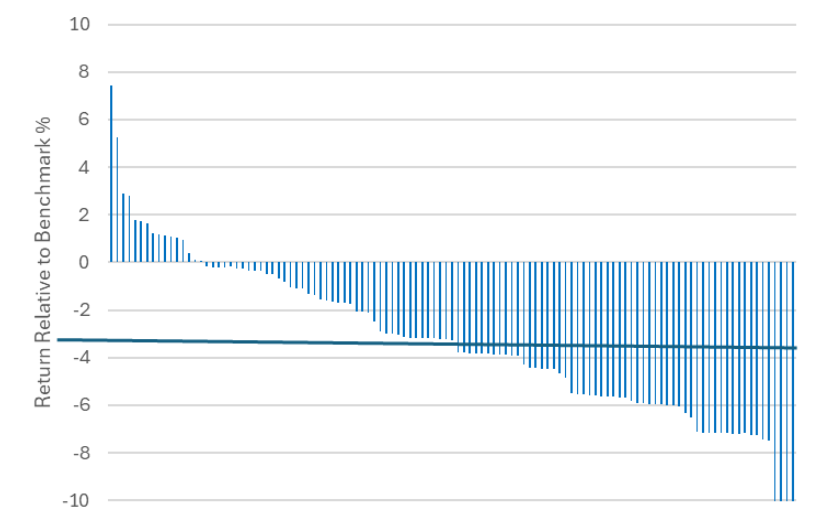
Total fund performance is driven by equity performance, as shown by the chart below. It seems that in recent years, as funds have diversified they have reduced equity exposure and given up some return.
However, in the latest year almost 90% of actively managed equity portfolios failed to outperform their benchmark index. The median (the thick blue line) underperformance was 3.3% for the year. Over the last three years the median underperformance was 2% pa and over five years 0.5% pa. Currently more than two thirds of equities are managed actively.
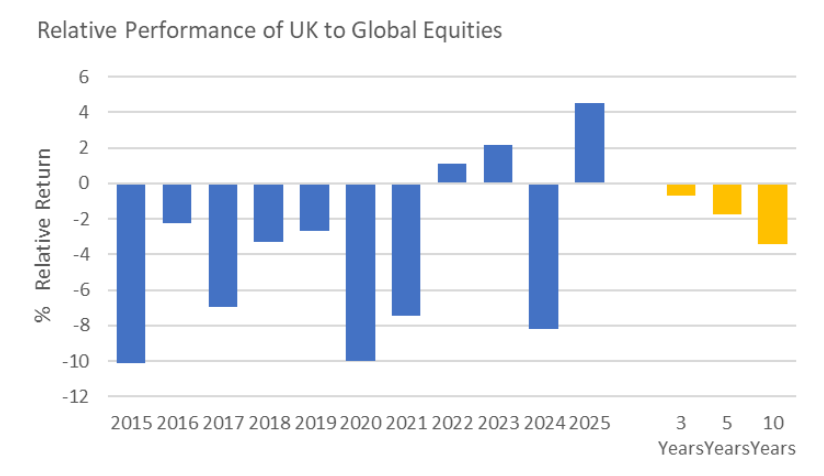
Despite delivering a higher return than global equities in three of the last five years UK equities have underperformed over the medium and longer term.
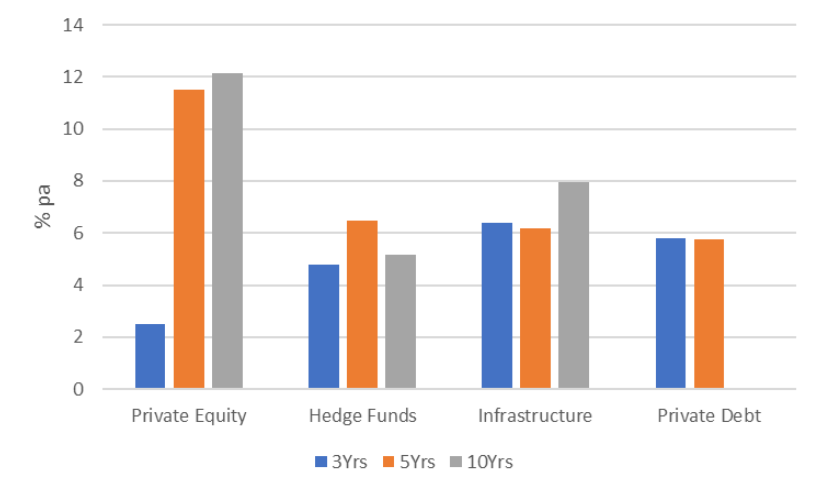
Private equity has delivered an excellent result over the decade, well in excess of quoted equity. More recently however the return is below that of quoted equity. Infrastructure and private debt have both delivered returns around 6% pa over the medium term. These returns are below the benchmark expectations of most funds.
Was this page helpful?