Membership
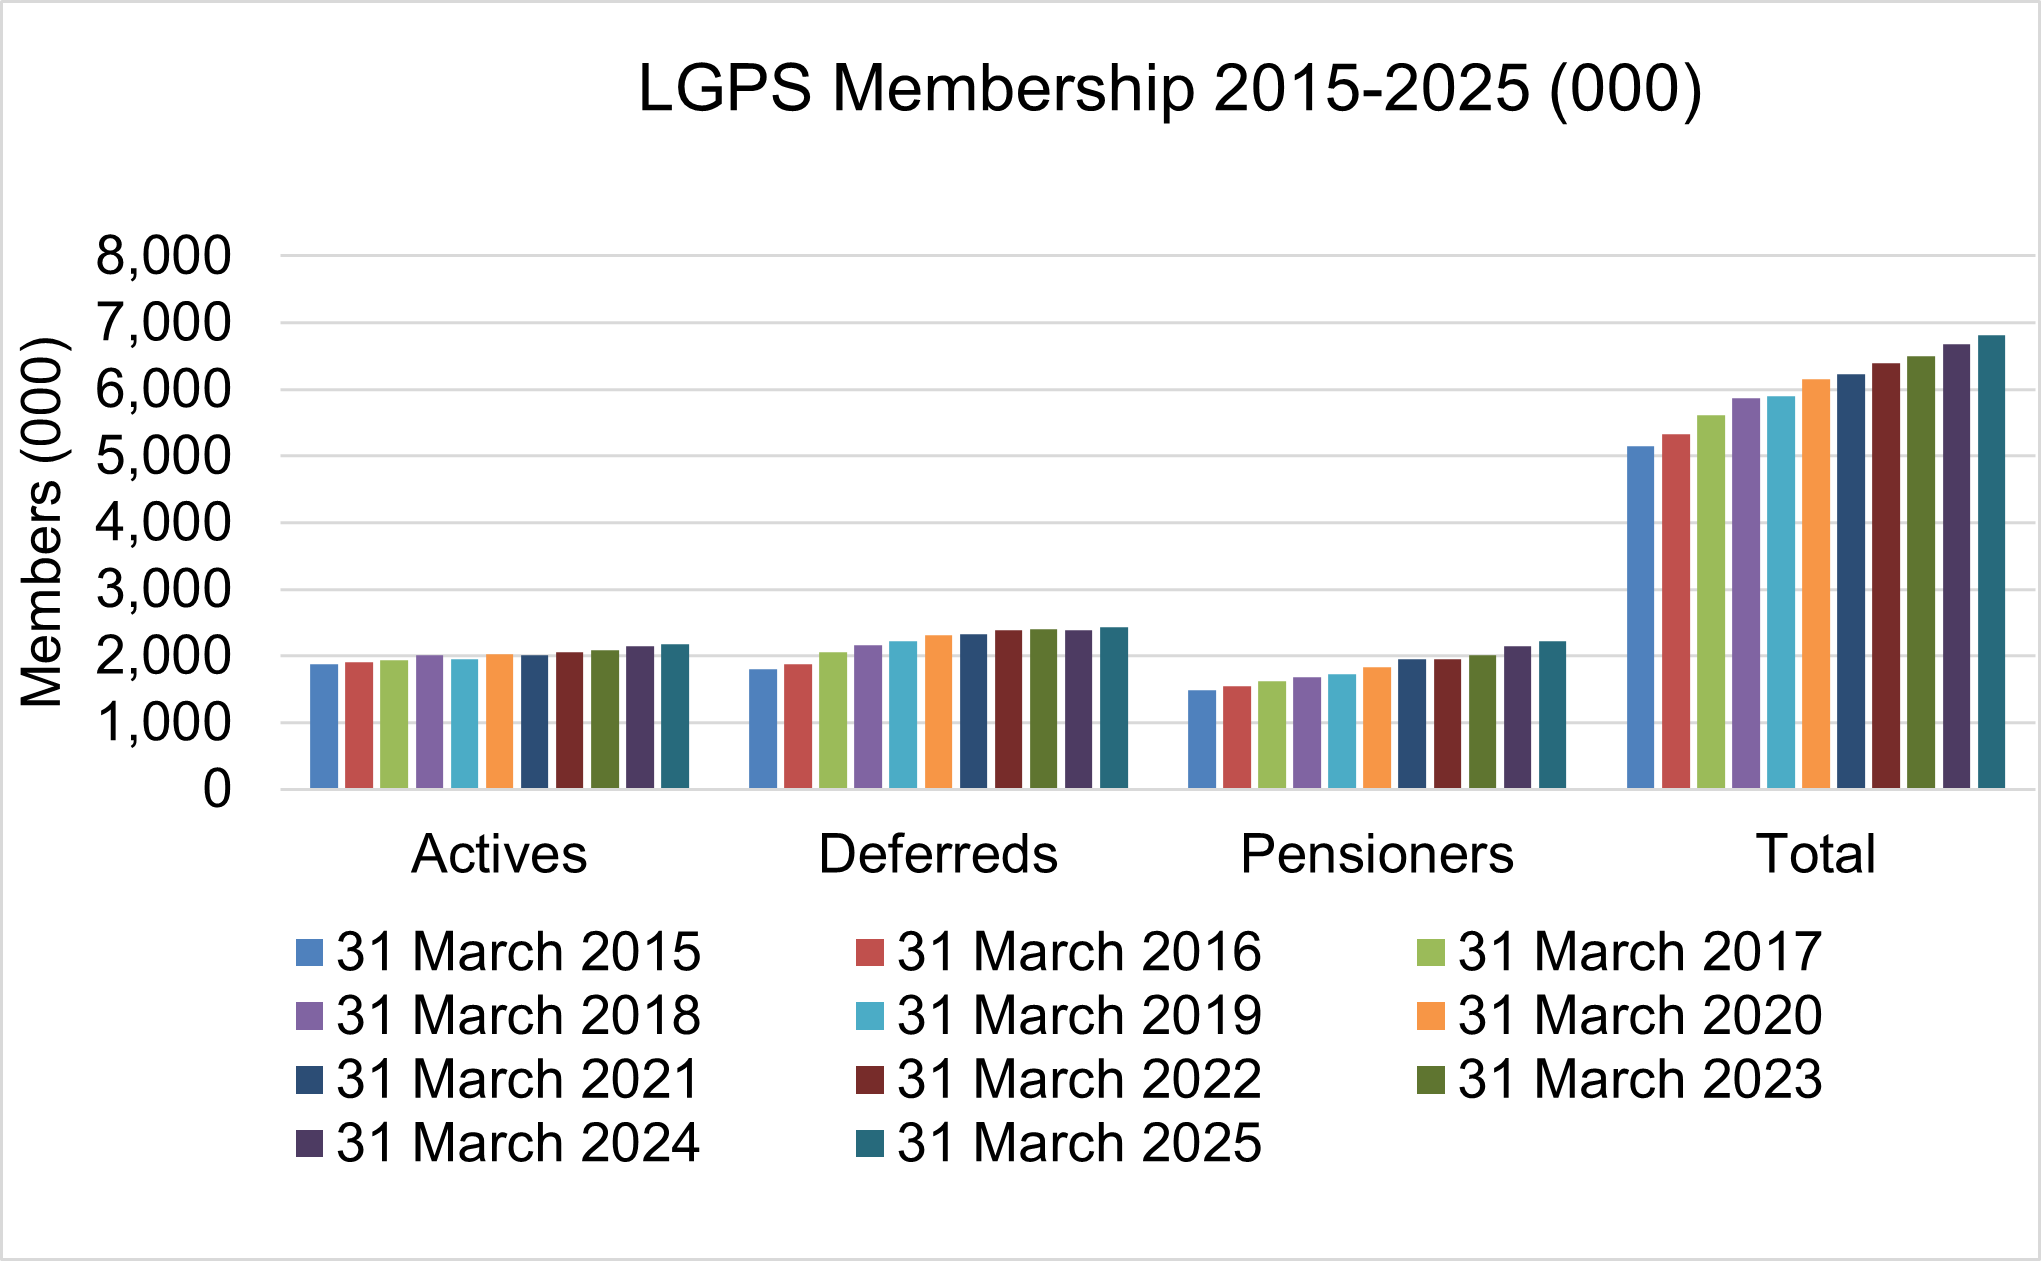
As at 31 March 2025, the total membership of the Scheme was 6.81 million, compared with 6.68 million as at 31 March 2024. The greatest increase in absolute and relative terms continues to be to pensioner membership, which increased by 1.15 per cent relative to total membership and 3.59 per cent relative to pensioner membership over the year to March 2025.
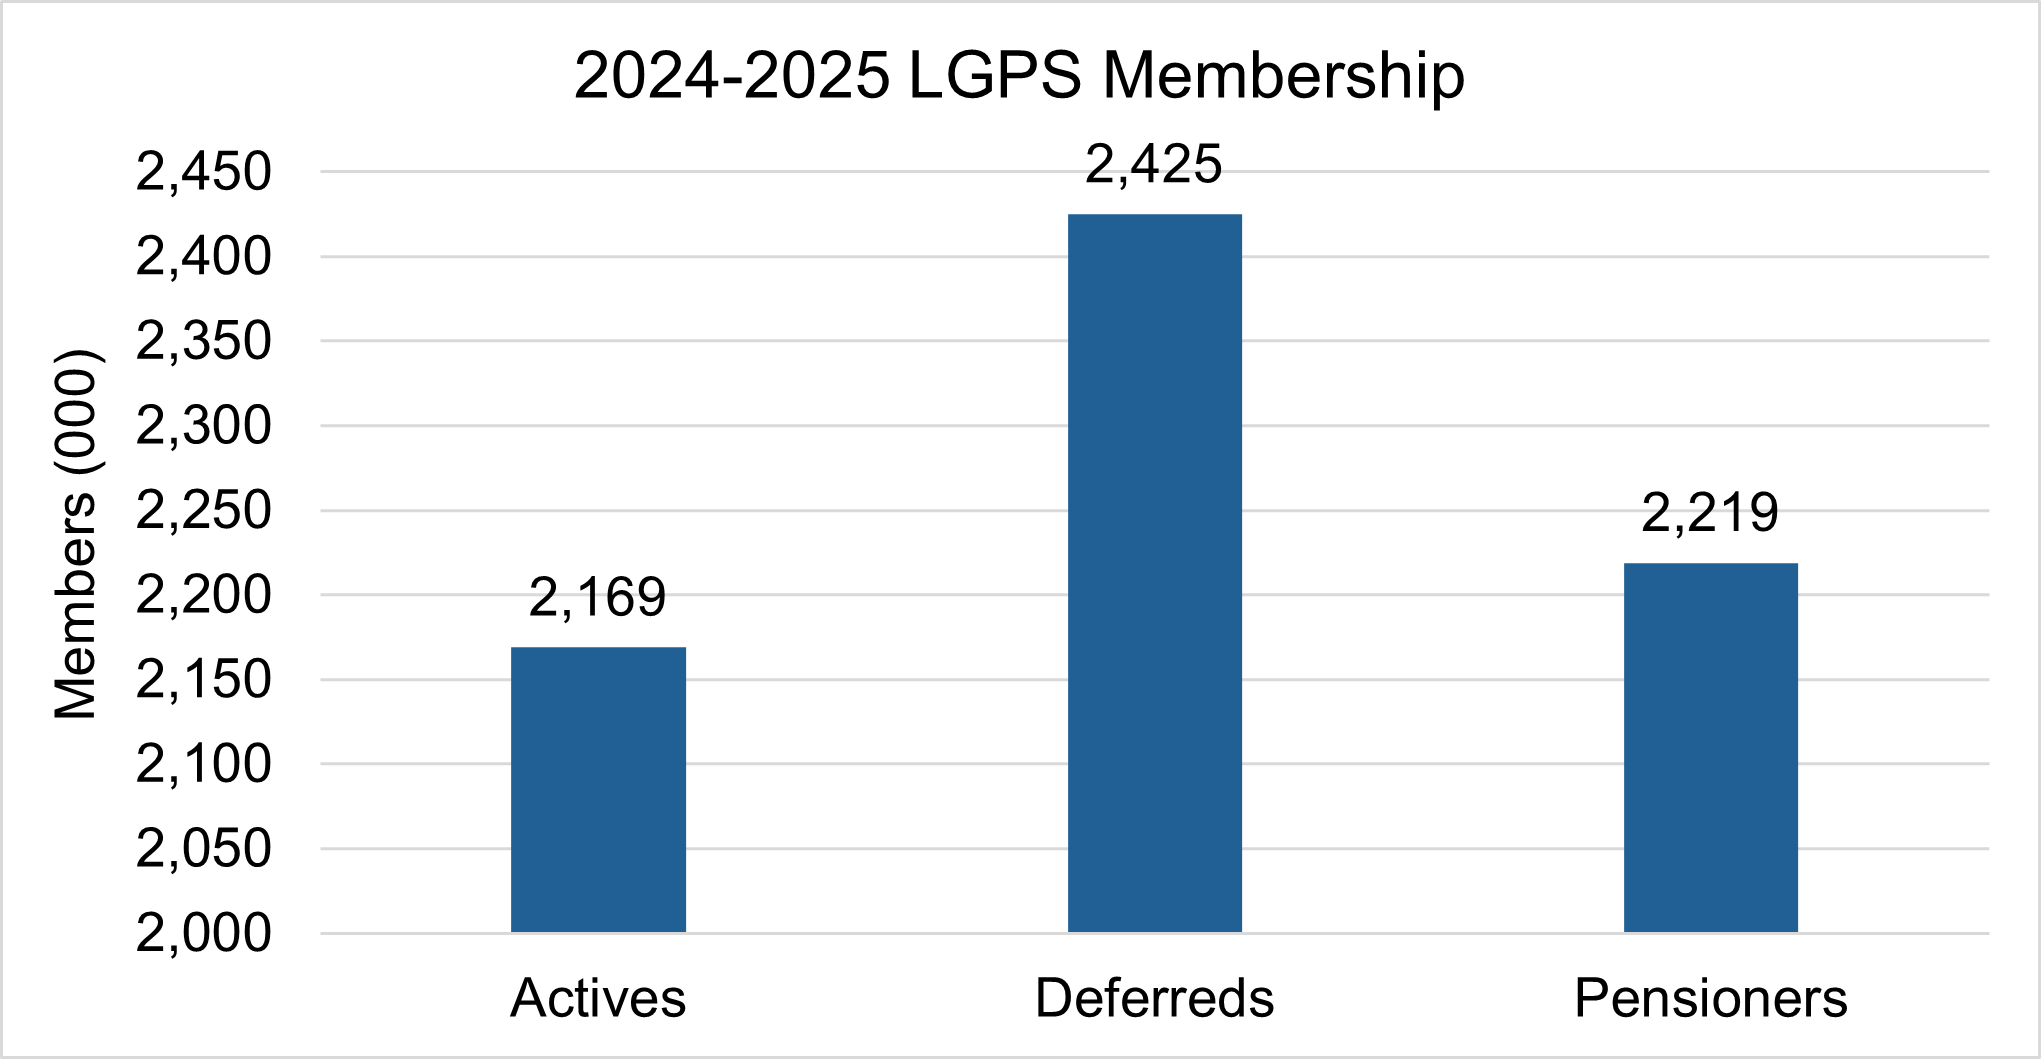
Active, deferred and pensioner membership of the LGPS have all continued to grow, although the increases have been smaller compared to recent years. LGPS membership as a whole has increased of 1.93 per cent over the year, relative to overall membership.
| Year | Actives (000) | Deferreds (000) | Pensioners (000) | Total (000) |
|---|---|---|---|---|
| 31 March 2015 | 1,870 | 1,798 | 1,487 | 5,155 |
| 31 March 2016 | 1,914 | 1,881 | 1,540 | 5,335 |
| 31 March 2017 | 1,941 | 2,052 | 1,625 | 5,619 |
| 31 March 2018 | 2,011 | 2,167 | 1,685 | 5,863 |
| 31 March 2019 | 1,957 | 2,214 | 1,728 | 5,899 |
| 31 March 2020 | 2,019 | 2,307 | 1,833 | 6,160 |
| 31 March 2021 | 2,018 | 2,328 | 1,881 | 6,226 |
| 31 March 2022 | 2,049 | 2,384 | 1,955 | 6,388 |
| 31 March 2023 | 2,090 | 2,398 | 2,006 | 6,494 |
| 31 March 2024 | 2,148 | 2,394 | 2,142 | 6,684 |
| 31 March 2025 | 2,169 | 2,425 | 2,219 | 6,813 |
| Increase (decrease) 2015 | 1.00% | 1.50% | 0.60% | 3.10% |
| Increase (decrease) 2016 | 0.60% | 1.20% | 0.80% | 2.60% |
| Increase (decrease) 2017 | 1.20% | 4.10% | 2.10% | 7.50% |
| Increase (decrease) 2018 | 0.80% | 1.40% | 0.90% | 3.10% |
| Increase (decrease) 2019 | (0.90%) | 0.90% | 0.60% | 0.60% |
| Increase (decrease) 2020 | 1.10% | 1.60% | 1.80% | 4.40% |
| Increase (decrease) 2021 | 0.00% | 0.30% | 0.80% | 1.10% |
| Increase (decrease) 2022 | 0.50% | 0.90% | 1.20% | 2.60% |
| Increase (decrease) 2023 | 0.60% | 0.20% | 0.80% | 1.60% |
| Increase (decrease) 2024 | 0.87% | (0.06%) | 2.03% | 2.84% |
| Increase (decrease) 2025 | 0.31% | 0.46% | 1.15% | 1.93% |
Growth in the sections of membership calculated relative to the total.
| Year | Actives | Deferreds | Pensioners | Total |
|---|---|---|---|---|
| 31 March 2015 | 36.30% | 34.90% | 28.80% | 100.00% |
| 31 March 2016 | 35.90% | 35.30% | 28.90% | 100.00% |
| 31 March 2017 | 34.60% | 36.50% | 28.90% | 100.00% |
| 31 March 2018 | 34.30% | 37.00% | 28.70% | 100.00% |
| 31 March 2019 | 33.20% | 37.50% | 29.30% | 100.00% |
| 31 March 2020 | 32.80% | 37.50% | 29.80% | 100.00% |
| 31 March 2021 | 32.40% | 37.40% | 30.20% | 100.00% |
| 1 March 2022 | 32.10% | 37.30% | 30.10% | 100.00% |
| 31 March 2023 | 32.20% | 36.90% | 30.90% | 100.00% |
| 31 March 2024 | 32.14% | 35.82% | 32.05% | 100.00% |
| 31 March 2025 | 32.45% | 35.59% | 32.57% | 100.00% |
Employers
As at 31 March 2025, the total number of employers with active contributing members was 15,704, compared to 15,049 in 2024.
The 2024 Annual Report Guidance also stated that employers should be reported by type, e.g., scheduled, admitted and designated bodies. This data was only reported in 85 per cent of fund annual reports so does not total the number of employers with active members.
| Scheduled bodies | Admitted bodies | Designated bodies | Total employers included in breakdown |
|---|---|---|---|
| 8,221 | 4,134 | 852 | 13,207 |
| Fund administering authority type | Count of funds | Average number of active employers per fund |
|---|---|---|
| Metropolitan Districts | 5 | 497 |
| County Councils/Unitaries | 38 | 278 |
| London Boroughs | 31 | 52 |
| Wales | 8 | 41 |
| Other | 5 | 140 |
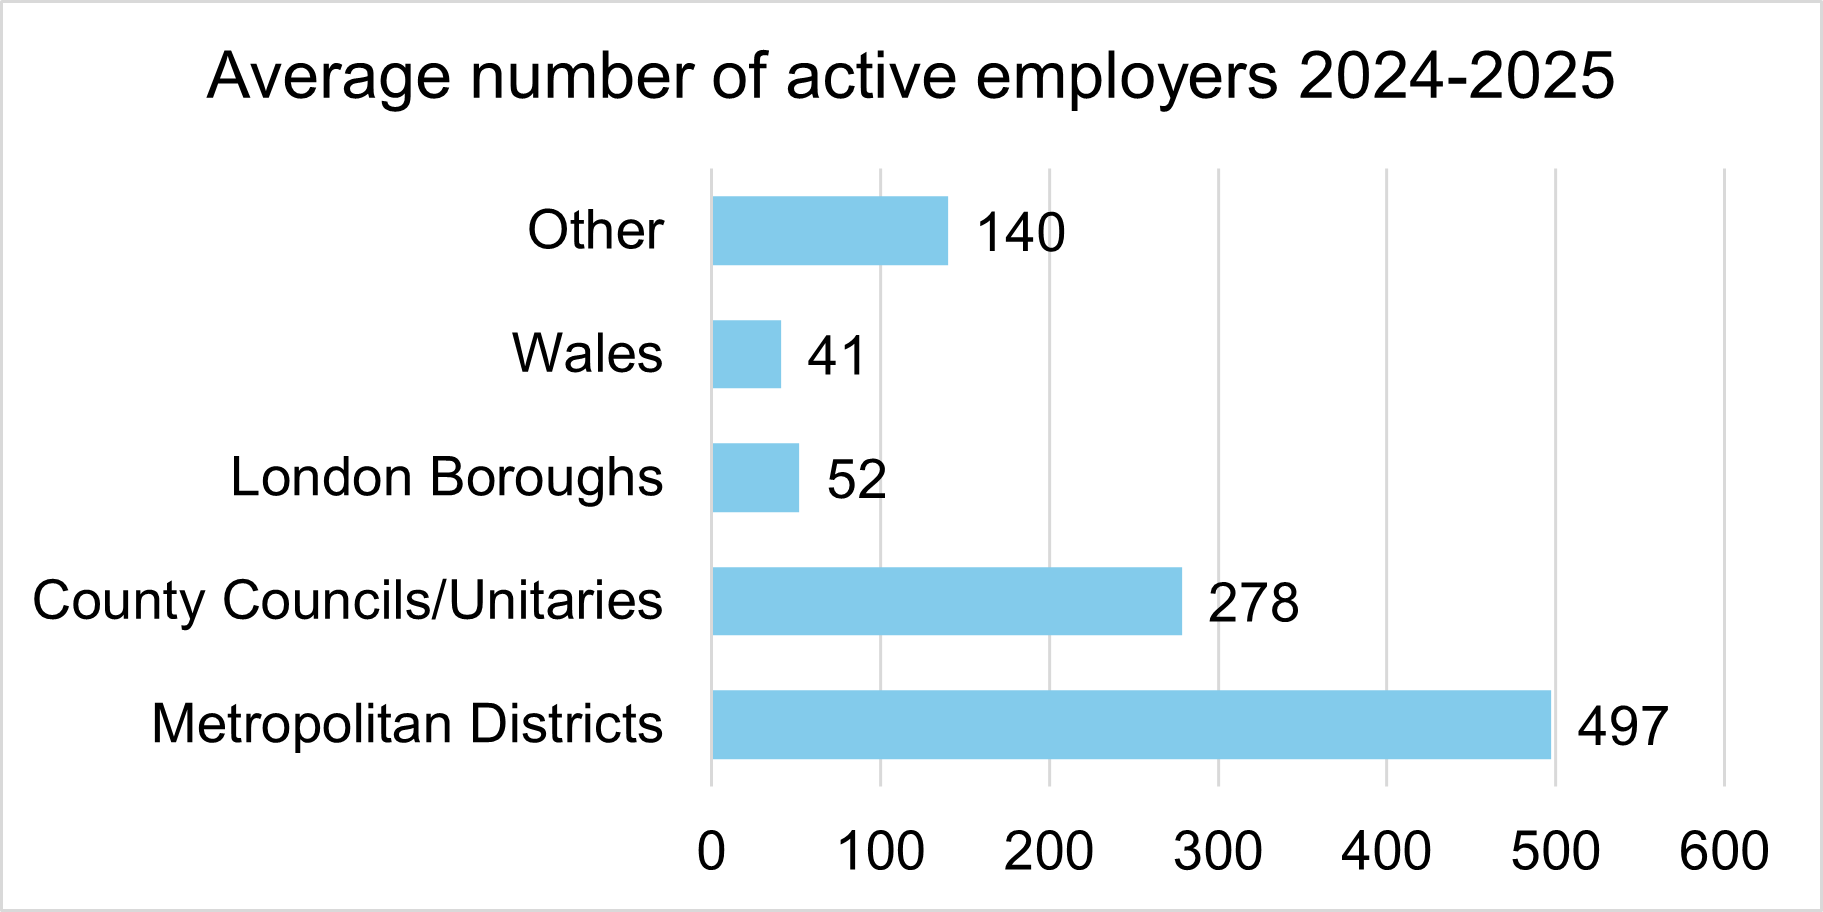
The chart shows how the average number of employers differs between the types of administering authority. Unitaries, Metropolitan Districts, and County Council administered funds typically have more participating employers compared with London Boroughs and Welsh funds. The ‘Other’ category comprises the London Pensions Fund Authority, South Yorkshire Pensions Authority, the Environment Agency funds and the City of London.
Was this page helpful?