Financial Performance
In line with other UK pension funds, each LGPS fund undertakes a local actuarial valuation every three years. The latest triennial valuation of the LGPS local assets and liabilities was undertaken as at 31 March 2025 but at the time of publication of this report, the results of those valuations are still being analysed. Each fund’s 2025 valuation report is available on this website, though, and a scheme-level summary report will be published in due course.
The data reported here, therefore, is still that from the earlier 2022 valuation.
There are also separate four-yearly scheme-level valuations that are conducted under directions issued by His Majesty’s Treasury and undertaken by the Government Actuary’s Department (GAD). These take place across all the public service pensions schemes, including the LGPS. The results of this valuation of the Local Government Pension Scheme (England & Wales) as at 31 March 2020were published on 29 February 2024.

| £ billion | Assets | Liabilities | Surplus/Deficit |
|---|---|---|---|
| 2010 | 141.6 | 178.5 | (36.9) |
| 2013 | 180.5 | 227.3 | (46.8) |
| 2016* | 216.6 | 254.3 | (37.7) |
| 2019* | 285.8 | 291.7 | (5.9) |
| 2022 | 361.1 | 339.0 | 21.1 |
*Figures restated in 2019 & 2022 valuations.
Development of LGPS funding position
Funding position data as at 31 March 2025 was reported in 75 annual reports, with an average of 126 per cent. When the reported funding levels are weighted by assets under management, the average funding position of the 75 funds was 114 per cent.
Aggregated information
We have the following aggregated information from the annual report and audited accounts of the LGPS funds as of 31 March 2025 showing the development of the LGPS. Importantly, this notes that active membership is maintained and income continues to exceed benefit payments which is consistent with the scheme remaining open to new entrants.
| 2025 | 2024 | 2023 | 2022 | 2021 | 2020 | 2019 | 2018 | 2017 | 2016 | 2015 | |
|---|---|---|---|---|---|---|---|---|---|---|---|
| Number of actives (000) | 2,169 | 2,148 | 2,152 | 2,049 | 2,018 | 2,019 | 1,957 | 2,010 | 1,964 | 1,899 | 1,905 |
| Number of deferred (000) | 2,425 | 2,394 | 2,337 | 2,384 | 2,328 | 2,307 | 2,214 | 2,159 | 2,078 | 1,859 | 1,834 |
| Number of pensioners (000) | 2,219 | 2,142 | 2,005 | 1,955 | 1,881 | 1,833 | 1,728 | 1,691 | 1,642 | 1,530 | 1,512 |
| Total value of assets (£bn) | 402 | 390 | 354 | 369 | 342 | 276 | 291 | 275 | 263 | 217 | 217 |
| Net return on Investment | 3.7% | 8.9% | -1.8% | 8.1% | 20.7% | -4.8% | 6.2% | 4.4% | 19.4% | 0.1% | 12.1% |
| Total contributions paid (£bn) | 13.5 | 13.1 | 11.1 | 11.6 | 13.9 | 10.2 | 9.5 | 11.8 | 9.7 | 9.3 | 9.6 |
| Total benefits paid | 16.8 | 14.9 | 13.0 | 12.6 | 12.0 | 11.1 | 10.5 | 9.9 | 9.7 | 9.4 | 9.0 |
| Inflation (CPI) (change over previous 12 months to September) | 3.80% | 2.50% | 3.20% | 8.80% | 0.50% | 1.70% | 2.40% | 3.00% | 1.00% | 0.00% | 1.20% |
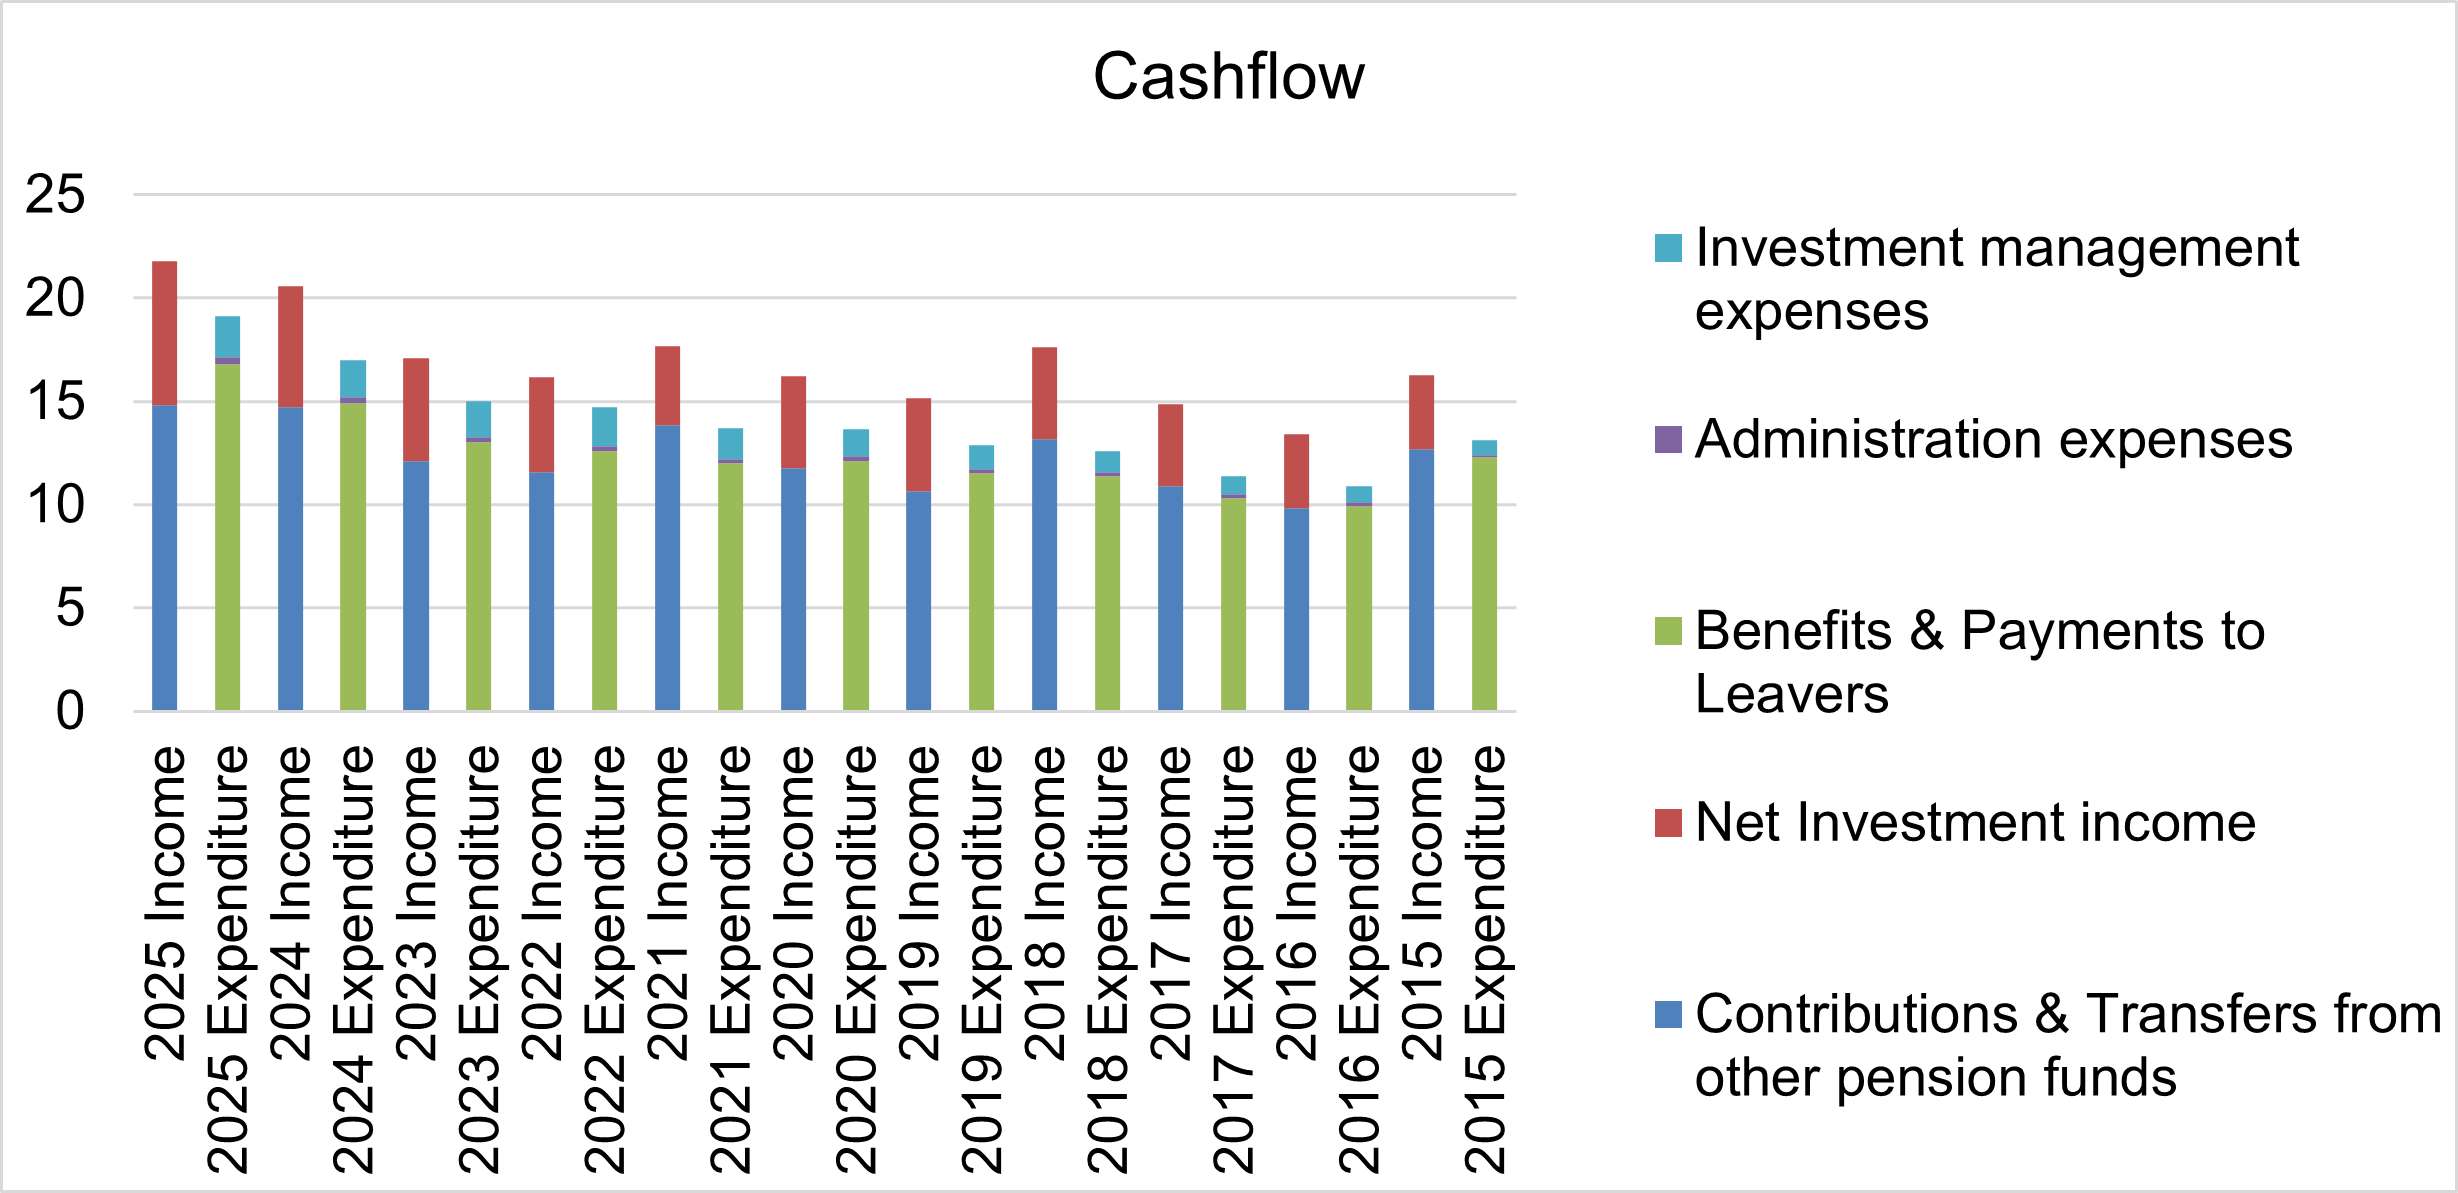
Income and Expenditure, year to 31 March 2025
| 2025 | 2024 | 2023 | 2022 | 2021 | 2020 | 2019 | 2018 | 2017 | 2016 | 2015 | |
|---|---|---|---|---|---|---|---|---|---|---|---|
| Contributions & Transfers from Other Pension Funds | 14.8 | 14.7 | 12.1 | 11.6 | 13.9 | 11.7 | 10.7 | 11.8 | 10.9 | 9.8 | 12.7 |
| Net Investment income | 7.0 | 5.9 | 5.0 | 4.6 | 3.8 | 4.5 | 4.5 | 4.4 | 4.0 | 3.6 | 3.6 |
| Total income | 21.8 | 20.6 | 17.1 | 16.2 | 17.7 | 16.2 | 15.2 | 17.6 | 14.9 | 13.4 | 16.3 |
| 2025 | 2024 | 2023 | 2022 | 2021 | 2020 | 2019 | 2018 | 2017 | 2016 | 2015 | |
|---|---|---|---|---|---|---|---|---|---|---|---|
| Benefits & Payments to Leavers | 16.8 | 14.9 | 13.0 | 12.6 | 12.0 | 12.1 | 11.5 | 10.4 | 10.3 | 9.9 | 12.3 |
| Administration expenses (including oversight and governance) | 0.3 | 0.3 | 0.3 | 0.2 | 0.2 | 0.2 | 0.2 | 0.2 | 0.2 | 0.2 | 0.1 |
| Investment management expenses | 2.0 | 1.8 | 1.7 | 1.9 | 1.5 | 1.3 | 1.2 | 1.0 | 0.9 | 0.8 | 0.7 |
| Total expenditure | 19.1 | 17.0 | 15.0 | 14.7 | 13.7 | 13.6 | 12.9 | 12.6 | 11.4 | 10.9 | 13.1 |
Cashflow before investment income
When looking at the gap between contribution income and benefit payments (i.e. excluding investment income), cashflow levels between funds ranged from -£285m to +£47.6m with the average being -£22.3m. 61 out of 86 (70%) funds reported experiencing negative cashflow before investment income was considered. This compares with a range of cashflow positions on that basis between funds in 2024 of -£324m to +£120m and an average of -£26.1m, with 67 funds in a negative cashflow position in 2024.
LGPS Life Expectancy Index
Executive summary
Life expectancy for LGPS pensioners has returned to pre‑pandemic levels following the disruption caused by COVID‑19. While this recovery is a positive sign for pensioners, it’s still too early to say with confidence whether life expectancy will keep improving at the same pace in the coming years. Continuing to track life expectancy for LGPS pensioners will help Funds spot trends early and plan with confidence.
Background
Club Vita supports most LGPS Funds by helping them understand what life expectancy looks like for their own membership. This insight helps Funds and their actuaries make informed decisions when setting longevity assumptions for triennial valuations.
Working with the LGPS Scheme Advisory Board, Club Vita has developed the LGPS Life Expectancy Index to help explain changes in life expectancy among LGPS pensioners in England and Wales in a clear and straightforward way. The Index also helps the Board keep track of any meaningful changes in life expectancy that could affect the long‑term affordability of benefits.
LGPS Life Expectancy Index
Long-term trends in LGPS pensioner life expectancy
The chart below shows the annual progression of the LGPS Life Expectancy Index between 1993 and 2024 for male and female LGPS pensioners in England and Wales. The Index measures the number of years a member is expected to live in retirement after reaching age 65.
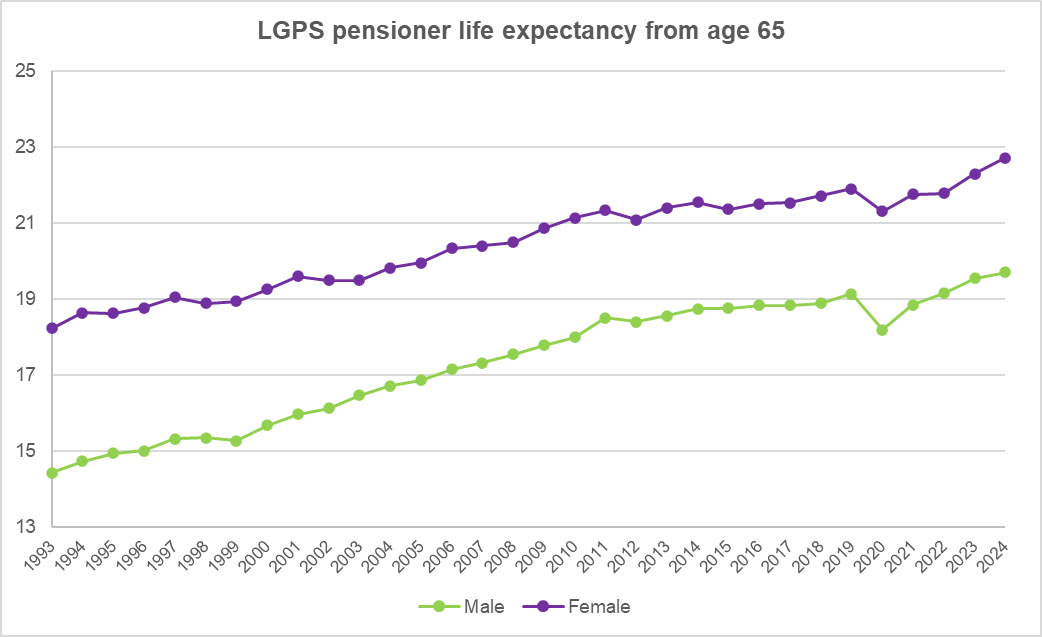
Looking back over the past 30 years, changes in life expectancy can be grouped into four broad phases:
- Steady gains (pre- 2011) – Life expectancy rose steadily through the 1990s and 2000s, with particularly strong progress during the 2000s. This was driven by general improvements in health, including better treatment for heart disease and declines in smoking.
- The slowdown (post‑2011) – During the 2010s, life expectancy continued to improve but much more slowly. This has been linked to a combination of pressure on health services, harsher winter and flu seasons and broader social and economic challenges.
- The pandemic shock (2020–2022) – The COVID‑19 pandemic caused a sharp and sudden fall in life expectancy. In a short space of time, many of the gains made over previous decades were temporarily reversed.
- Post‑COVID recovery (2023 onwards) – More recent data suggests that life expectancy is recovering following the pandemic.
Interpreting the latest life expectancy data
The latest figures show that life expectancy for LGPS pensioners has returned to where it was before the pandemic and is now at its highest level so far. This is a positive sign. However, the picture is still unfolding and it’s still too early to say with confidence whether life expectancy will continue to improve at the same pace in the years ahead.
Each new year of data helps us understand how life expectancy is changing. Until a clearer pattern emerges, it is important to monitor developments. Further analysis of 2025 life expectancy will be included in the next edition of the LGPS Life Expectancy Index.
Why reflecting diversity matters
The Index shows average life expectancy for male and female LGPS pensioners. This gives a useful high-level picture, but it doesn’t tell the whole story.
LGPS members are a diverse group and life expectancy can vary a lot depending on factors such as where members live and their socio‑economic background. Club Vita analysis shows a gap of more than nine years between the longest and shortest‑lived pensioners, highlighting just how different individual experiences can be.
Recognising this range helps Funds build a more realistic view of future costs and better understand how cashflows may develop over time. Funds that do not currently receive longevity analysis from Club Vita can contact Jill Jamieson, Head of Pensions UK at Club Vita, for support in better understanding the demographic profile of their membership.
LGPS experience compared with the wider UK population
LGPS pensioners tend to live longer than the UK population as a whole. This is likely linked to the characteristics of LGPS membership, including socio‑economic factors and the financial security that comes from receiving a guaranteed income in retirement. Even during the COVID‑19 pandemic, LGPS pensioners appear to have been less affected than the population as a whole.
This means that trends seen in the wider UK population won’t always play out in the same way for LGPS members and sometimes the opposite can happen. Tracking how LGPS and the Fund’s experience evolves over time therefore helps build a more accurate understanding of what’s really happening for Fund members.
Emerging drivers of future life expectancy
Recent changes in life expectancy are a reminder that longevity doesn’t improve in a straight line and it can change quickly. While the pandemic had a significant short-term impact, it’s the longer-term factors that are likely to shape life expectancy over the coming decades. Some of the key areas to keep an eye on include:
- Medical breakthroughs – Advances in medical science, including new treatments for obesity and diabetes, could improve population health and life expectancy over time. How much difference they make will depend on how widely they are used and whether they lead to lasting changes in health and lifestyles.
- Technological innovation – Technology is playing a growing role in healthcare. For example, tools using artificial intelligence are increasingly being developed to help spot disease earlier and support more tailored treatment. Over time, this could lead to earlier interventions and better health outcomes.
- Climate change – Climate change can affect health in many ways, from air quality and extreme weather to food and water security and the spread of infectious diseases. Because of this, its potential impact on long‑term population health and life expectancy is becoming harder to ignore. Club Vita’s Still Hot and Bothered? report contains three climate-related longevity scenarios that LGPS Funds can use to quantify the impact of climate change on longevity.
Looking ahead, there is no single, certain path for how life expectancy will develop. Thinking about a range of possible outcomes, rather than relying on one fixed view, can help LGPS Funds understand uncertainty and stay prepared for different longevity outcomes in the future.
Definition of period expectation of life
Source: Office for National Statistics, “Life expectancy at age 65 by local areas in the United Kingdom, 2004-06 and 2008-10”, 19 October 2011
“Period expectation of life at a given age for an area in a given time period is an estimate of the average number of years a person of that age would survive if he or she experienced the particular area’s age-specific mortality rates for that period throughout the rest of his or her life. The figures reflect mortality among those living in an area in each time period, rather than mortality among those born in each area.” “Period life expectancy at age 65 in 2000 is worked out using the mortality rate for age 65 in 2000, for age 66 in 2000, for age 67 in 2000, and so on.” “Period life expectancies are a useful measure of mortality rates actually experienced over a given period, and for past years, provide an objective means of comparison of the trends in mortality over time, between areas of a country and between countries. Official life tables in the UK and other countries which relate to past years are generally period life tables for these reasons.”
Methodology
- The LGPS Life Expectancy Index tracks the life expectancy of England and Wales (E&W) LGPS pensioners. The methodology ensures the Index results are objective and reflect the experience of E&W LGPS members.
- The Index is based on period life expectancy from age 65. For each year this is a measure of how long you expect to make pension payments to an average member based on death rates in that year.
- This approach to measuring life expectancy uses only observable, verifiable and avoids any need for subjective assumptions about how life expectancies will change in the future.
- The Index allows changes in life expectancy from year to year and trends in life expectancy emerging over a number of years, to be clearly identifiable.
Calculations
- The starting point for the LGPS Life Expectancy Index is the collection of a complete and reliable record of longevity experience data for the LGPS. Club Vita collect experience data for c.2/3rds of E&W LGPS Funds.
- Once data has been collected, the calculation steps involved in producing the LGPS Life Expectancy Index are broadly as follows:
- For a reference period (e.g. calendar year 2011) and a reference population (e.g. E&W LGPS pensioners) where data has been collated, determine the observed (“crude”) death rate at each age (65, 66, 67, etc.).
- The crude death rate at each age is simply the number of deaths at that age divided by the number of people being observed at that age. So it is an observable (objective) quantity, measuring the proportion of people that died at each age.
- The period life expectancy from 65 can be calculated directly from the crude death rates and is the average length of time an individual aged 65 would live for, based on those observed death rates.
Was this page helpful?