Detailed report
Introduction
On 31 March 2026, the 2025 actuarial valuations for 87 funds participating in the England & Wales Local Government Pension Scheme (LGPS) were completed. The two main purposes of these valuations was to consider the funding position of each LGPS fund and to set employer contribution rates in each fund for the period from 1 April 2026 to 31 March 2029.
This report summarises the data collected from 86 of the 87 funds (the closed Environment Agency Fund has been excluded) individual Pension Funds in England & Wales that participate in the LGPS to provide a scheme wide overview. It compares the 2025 valuation results to the 2022 valuation results as well as looking at the assumptions used, the investment strategies and the gender pensions gap. The full list of LGPS funds analysed is shown in Appendix 1.
In carrying out our research we have reviewed the valuation reports provided and received support from the Local Government Association (LGA) and Barnett Waddingham on a no-fee basis. Our report provides a summary of the valuation position reported by LGPS funds and does not replace the statutory Section 13 report, which provides a formal analysis of each fund’s approach. We have used the information set out in the valuation dashboard for each fund, as agreed between the fund actuaries and the Government Actuary’s Department (GAD). This dashboard is publicly available as it is published in each of the local fund valuation reports.
This report explores some of the key findings and is split into the following sections:
- Executive summary
- Data
- Financial assumptions
- Demographic assumptions
- Funding results
- Gender Pensions Gap
Please contact the Scheme Advisory Board secretariat for further information.
Actuarial firms
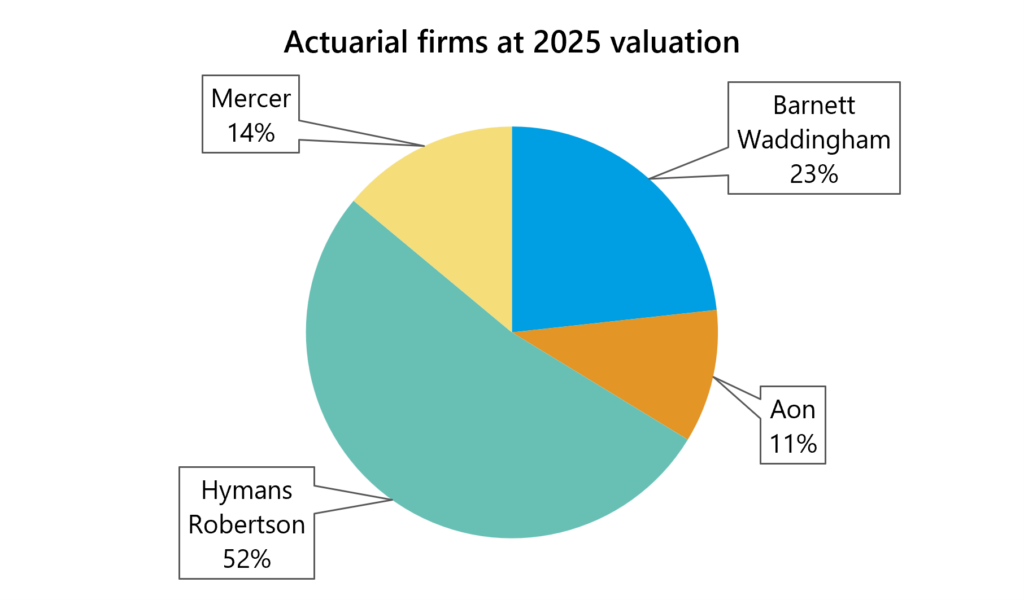
The 2025 valuation reports were prepared by the Fund actuaries of each LGPS fund. Although each fund has their own funding approach, a consistent approach is generally taken by funds advised by the same actuarial adviser.
The diversity of approach, and consistency of themes, is a key strength of the LGPS funding approach. The variation in approach means, taken as a whole, the LGPS is more robust because:
- it is tailored to the needs of the participating employers which vary, this is essential to ensure they can afford to pay the contributions;
- it supports constructive challenge on what “good” looks like, in terms of the balance between risk and cost; and
- it drives innovation in approach.
- the diversification across funds within the LGPS provides protection at an aggregate national level and ultimately to the taxpayer.
The split of the number of LGPS funds advised by each actuarial firm is shown in this chart:
Current issues
There have been a lot of significant developments since 2022 which have affected the 2025 LGPS valuations. Funds were faced with various issues surrounding the valuation including:
- High inflation: Inflation was higher than assumed by all LGPS funds, with funds being required to pay pension increases of 10.1% in 2023 and 6.7% in 2024. Some funds did build in an allowance for high inflation in their 2022 valuation but nevertheless, high inflation led to an increase in fund liabilities as well as having implications for cashflow.
- The ongoing impact of the McCloud/Sargeant case: As part of the 2022 valuation, an allowance was made for McCloud by all LGPS funds. However it was not until 1 October 2023 that the LGPS McCloud remedy regulations became law. For the 2025 valuation, liabilities needed to reflect that eligible members may receive a pension uplift at retirement if their benefits would have been higher had they continued to accrue service in the discontinued final salary scheme until 31 March 2022. Since the 2022 valuation, LGPS funds have been collecting additional data for each member to allow for a more data-driven approach at the 2025 valuation which relies less on actuarial and data estimates (where data was available at the time of the valuation).
- Updated Funding Strategy Statement (FSS) guidance: In January 2025 SAB published updated guidance for funds on producing their FSS. There were a number of new considerations for funds and many funds rehauled their FSS which resulted in further additional work. There was an increased focus on employer engagement, with all funds required to produce an “Engagement Plan” which set out details of how the fund will engage in meaningful dialogue and engage with employers and other parties.
- Fit for the Future requirements: On 29 May 2025, the Government issued its response to the Fit for Future consultation. One requirement was for all listed assets to be moved “under the management of the pool” by 31 March 2026. Government also reduced the number of asset pools from eight to six, and therefore there has been additional burden on a number of funds who have needed to change asset pool. Although this does not have a direct impact on the valuation results, there may be some indirect impact on investment returns and fund expenses (and therefore funding). As well as the pooling requirements, there are new governance expectations for LGPS funds through the “Fit for the Future” requirements. These will mandate funds to undertake independent governance reviews, introduce the role of the independent person, and raise the bar for the knowledge and understanding of pension committees
- Access and Fairness consultation: On 2 February 2026 the government published their response to the Access and Fairness consultation for LGPS funds. This consultation aims to improve fairness in terms of pension benefits, reduce inequalities which disadvantage women, survivors and lower-paid workers, and improve access to pension protection. This is likely to increase the administrative burden on LGPS funds from, for example, equalising survivor pensions and collecting opt-out data. These changes will increase liabilities for all funds but funds are unlikely to have made an allowance for the changes due to timing. However, the impact on the valuation results is likely to be small or immaterial. The Access and Fairness consultation also introduced requirements for LGPS funds to report on their gender pensions gap as part of the 2025 valuation. This is covered later in this report.
- Additional guarantees put in place for Further Education bodies: In November 2024, the Department for Education (DfE) put in place a guarantee provide assurance to LGPS pension fund managers that FE bodies should not be treated as ‘high-risk’ employers. Therefore there has been a reduction in the number of employers treated as “tier 3” at the 2025 valuation. Tier 3 employers are those without the financial backing of an external employer, and hence a more prudent approach is taken to the valuation of their liabilities.
- Local Government Reorganisation (LGR): Many funds will have considered LGR as part of setting their employer contribution rates as there was some uncertainty around the future of many major employers participating in the funds.
Funding level improvements
The 2025 actuarial valuations have seen an improvement in overall funding levels and an increase of the number of funds reporting a more than fully funded position. This is representative of the relative growth in assets compared to liabilities, and higher discount rates being adopted to value these liabilities as a result in the improved market outlook, including the rise in long-term gilt yields. This has posed a challenge to actuaries and administering authorities in fulfilling their obligations under regulation 62 of the LGPS regulations. Under this regulation, actuaries must balance the long-term cost efficiency of the Scheme and its solvency whilst maintaining a stable contribution rate for employers.
The overall funding level increased from 107% in 2022 to 122% in 2025, continuing the trend of improving funding levels from 2019. All but six funds reported an improved funding position. This is a positive outcome for the LGPS.
On the liability side, the movement will depend on the impact that changes in market conditions will have had on each Fund’s local funding basis. Generally, high short-term inflation will lead to an increase in the value placed on the liabilities, although, as detailed above, it may have been built into the valuation of the liabilities to some extent. To offset this, as the market outlook has generally improved, this will have led to a decrease in the liabilities if a fund used a higher discount rate. In particular, since 2022 we have also seen significant increases in the long-term market risk-free rate (i.e. gilt yields). Therefore, there may be a further impact on funds using a discount rate which is set in relation to the inflation assumption and/or gilt yields. For example, if a discount rate is set with reference to gilt yields, then liabilities may be expected to have decreased significantly following 31 March 2022 due to a significant increase in gilt yields since this date.
On the asset side, LGPS funds have experienced a wide range of investment returns over the intervaluation period. Some funds have performed well above the assumed investment return in 2022, improving the funding position. For other funds, investment performance has been lower than that assumed at the 2022 valuation which will lead to a worsening in the funding position (in isolation).
The funding position and resulting contributions are based on assumptions about future factors such as investment returns, inflation and life expectancy. As these are uncertain, different assumptions and funding parameters are used by each LGPS fund to reflect their own views, circumstances and strategic objectives. These differences (amongst other factors including crucially the previous funding level and employer short and long-term affordability) will lead to differences in funding positions and contributions across LGPS funds.
Data
Membership data
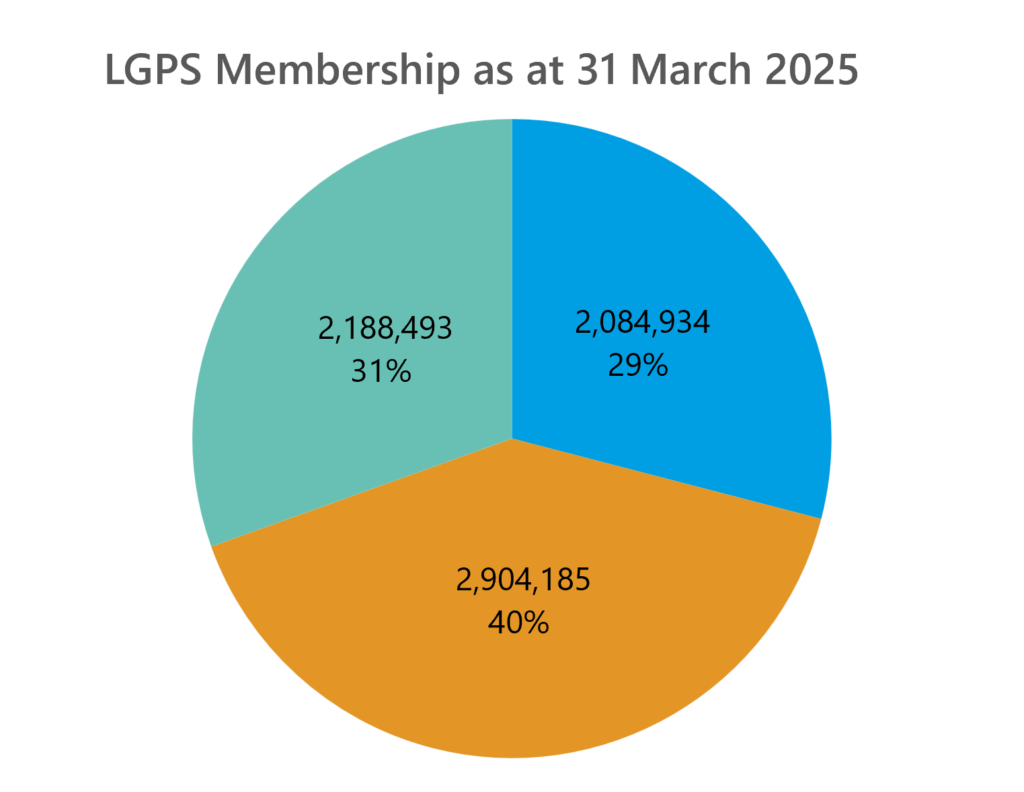
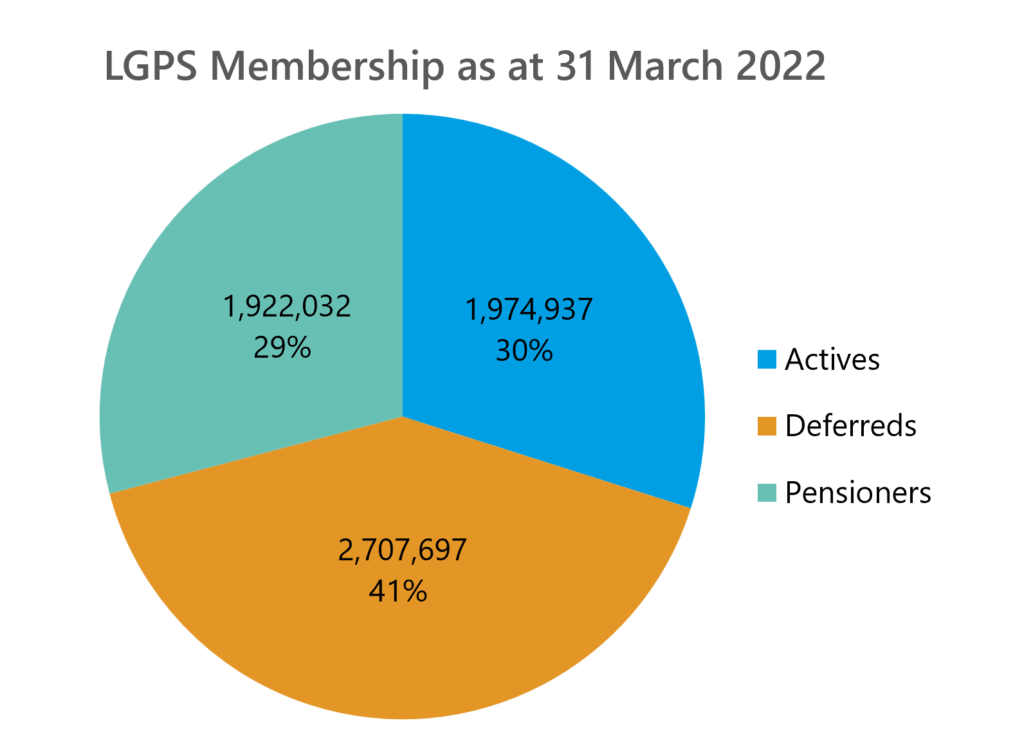
The LGPS continues to increase in size with total membership increasing from 6.6m[1] members in 2022 to 7.1m in 2025. The split of membership is summarised in the charts below. Please note that individuals may have multiple membership records due to different contracts etc. The actuarial valuations consider benefits by record rather than by member and therefore this count may be higher than the number of individual LGPS members.
[1] Please note that this figure differs from the Scheme Advisory Board’s 2025 Scheme annual report and we believe this is to do with how aggregated membership and multiple records have been treated. The figures in the table also differ due to the treatment of undecided members.
This table sets out a comparison of the key membership statistics at the 2022 and 2025 valuations:
| Membership summary | Number (000s) | Total annual pensionable pay/pension (£ms) | Average age | |||||
| 2025 | 2022 | % change | 2025 | 2022 | % change | 2025 | 2022 | |
| Actives | 2,085 | 1,975 | 6% | 48,926 | 39,324 | 24% | 51.6 | 50.8 |
| Deferreds | 2,904 | 2,708 | 7% | 4,985 | 3,960 | 26% | 52.0 | 51.0 |
| Pensioners | 2,188 | 1,922 | 14% | 12,134 | 9,710 | 25% | 71.1 | 70.0 |
| Total | 7,178 | 6,605 | 9% | |||||
Please note that the average ages disclosed in the 2025 valuation reports are weighted by pension or by liability depending on the fund. The average age shown in the table above is a simple average of the disclosed average ages and so is representative of neither
Investment strategy
The overall allocation of assets of the funds analysed in this report is set out in the chart below. For some more specific asset classes an allocation has been made to a class which is believed to be appropriate.
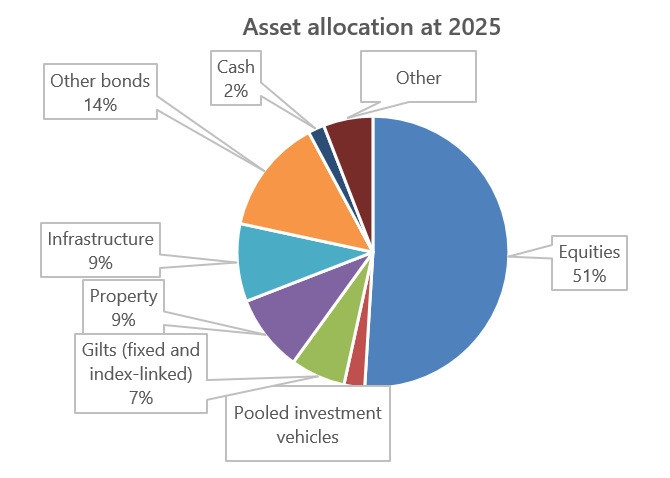
This is roughly a 70/30 split between growth and protection assets (classing equities, pooled investment vehicles, property and infrastructure as growth assets). This is a similar split to 2022, however there are some differences to note:
- It appears that funds are reducing the proportion of their assets held in gilts and are moving to strategies involving a greater percentage of corporate bonds. Indeed, between the 2022 and 2025 valuations, the proportion held in “Other bonds” (i.e. non-government bonds) has increased markedly from 9% to 14%. This could be due to the large surplus positions seen by funds meaning, they have more scope to invest in higher yield (and so higher risk) bonds. These bonds still have good matching characteristics to long tailed pension liabilities, and the 2% reduction in “Equities” investment between the 2022 and 2025 valuations is encouraging of funds still adopting a risk averse approach.
- There has been a slight increase in allocation to infrastructure from 6% at 2022 to 9% at 2025. This is a continuation of the trend seen between the 2019 and 2022 valuations and is perhaps representative of increasing pressure on the LGPS to invest in projects which are seen to give back to the community.
Financial assumptions
The financial assumptions used by the funds will determine the estimated value of the amount of benefits and contributions payable at the valuation date. This section outlines findings split between the different key assumptions which are:
- Discount rate (i.e. assumed investment return on the fund’s assets)
- Inflation
- Real discount rate (margin above inflation)
- Salary increases
Discount rate
The discount rate assumption is the key assumption driving the value of each fund’s liabilities. To determine the value of accrued liabilities and future contribution requirements at any given point in time it is necessary to discount future payments to and from the fund. There are a number of different approaches which can be adopted in deriving the discount rate to be used and the approach that is most appropriate will depend on the purpose of the valuation and the overall funding objectives and risk appetite of the fund. Therefore each actuary and Fund will derive their assumptions in an appropriate way.
It is important to note that the discount rate sometimes varies between employers and employer groups in each fund, reflecting covenant strength and funding approach. Where this is the case we have included the assumptions relating to the most significant employers (in terms of liabilities).
This table shows how the discount rate has changed over the intervaluation period.
| 2025 | 2022 | |||
| Discount Rate | Fund | Discount Rate | Fund | |
| Mean | 5.5% | 4.4% | ||
| Max | 6.8% | Barnet | 5.2% | London Pensions Fund Authority |
| Min | 4.5% | Southwark/West Yorkshire | 3.4% | Lambeth |
| Range | 2.3% | 1.8% | ||
As you can see, the average disclosed discount rate used in the valuation increased considerably to 5.5% p.a. at 2025, with the range of discount rates increasing since 2022. The average discount rate assumption of 5.5% roughly translates to an assumption of CPI plus 3.0%. This is based on the average CPI assumption of 2.5% across the funds but as noted above, the approach to deriving the discount rate differs by fund.
All else being equal, an increase in the discount rate decreases the value of the liabilities and improves the funding position.
This chart illustrates the number of funds adopting discount rates within each range shown (and includes 2022 for comparison):
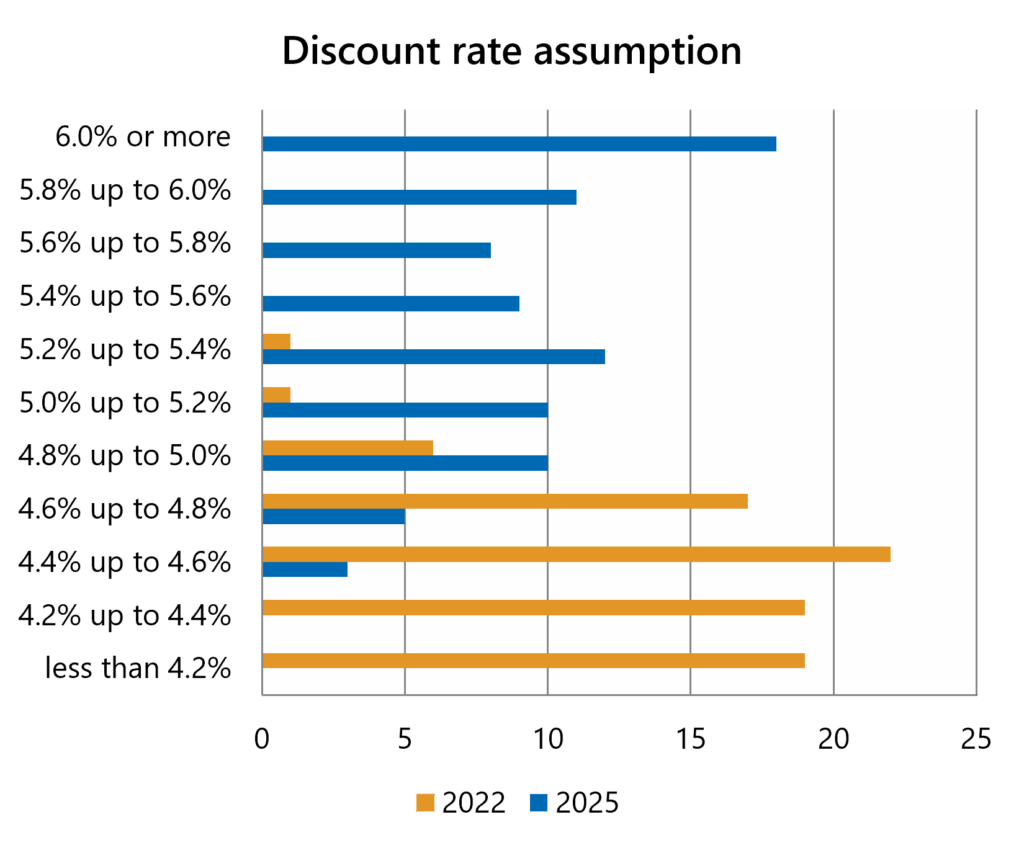
83 of the 85 funds analysed at both the 2022 and 2025 valuations saw an increase in the discount rate assumption between valuations. The graph above illustrates how significant the change between 2022 and 2025 was in terms of the discount rates set. The increase in discount rates would result in stronger funding positions when compared with 2022, in isolation.
Inflation
In the LGPS, the Consumer Prices Index (CPI) is the current inflation measure used to index pensions in payment and deferment, and to revalue members’ CARE benefits for service accrued after 31 March 2014. The increase is set out each year in the public service pensions increase order issued by HM Treasury.
The average disclosed CPI inflation assumption used decreased from 2.8% p.a. in 2022 to 2.5% p.a. in 2025. All else being equal, this would have led to a decrease in the value of the liabilities as benefits are assumed to increase at a slower rate.
Real discount rate
The relationship between the CPI inflation assumption and the discount rate assumption, the real discount rate, is arguably the most important financial assumption. For example a 0.1% increase in the inflation assumption combined with a 0.1% increase in the discount rate assumption results in very little change to the estimated value of the liabilities but a 0.1% increase in the inflation assumption combined with a 0.1% decrease in the discount rate assumption, i.e. a fall in the real discount rate of 0.2%, could lead to an increase in the value of the liabilities of around 4%.
This table shows some statistics related to the real discount rate at both the 2022 and 2025 valuations. The range at the 2025 valuation is significantly wider, which is largely on the discount rate side of the assumption but suggests that in general, funds are anticipating much higher future investment returns above inflation. On the contrary, the inflation assumption has remained relatively consistent between valuations as noted above despite the very high levels of inflation seen during the intervaluation period.
| 2025 | 2022 | |||
| Real Discount Rate | Fund | Real Discount Rate | Fund | |
| Mean | 3.0% | 1.6% | ||
| Max | 4.5% | Barnet | 2.3% | London Pensions Fund Authority |
| Min | 2.0% | 3 Funds* | 0.7% | Greater Manchester |
| Range | 2.4% | 1.6% | ||
*Essex, Barking and Dagenham and Lincolnshire
This table shows some statistics regarding the change in real discount rate assumptions between the 2022 and 2025 valuations.
| Change in real discount rate | Fund | |
| Mean | +1.4% | |
| Max | +2.8% | Isle of Wight |
| Min | +0.1% | LPFA |
| Range | 2.7% |
This graph shows the change in real discount rate assumptions between the 2022 and 2025 valuations:
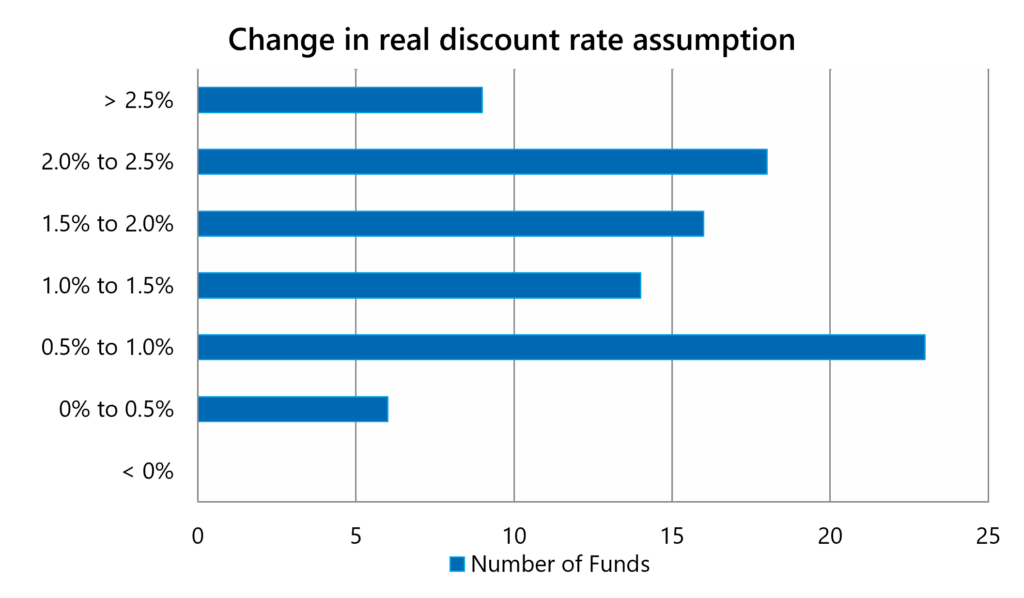
All funds saw an increase in the real discount rate assumption which, all else being equal, would have led to a decrease in the value of the liabilities. Indeed, 42 funds saw an increase in the real discount rate over or equal to 1.5%. This complemented strong asset performance and was one of the biggest reasons for the large increase in funding levels seen at this valuation.
Salary increases
As the LGPS is now a CARE scheme, the benefits earned after 31 March 2014 are revalued with inflation rather than salary increases. This means that the overall effect on valuation results of the salary increase assumption is less significant than it has been previously (ignoring any effects of McCloud remedies) and would not affect the contribution calculations. However, it still affects all pre-2014 accrued active liabilities.
This table shows some statistics related to the salary increase assumptions used at the 2025 and 2022 valuations.
| 2025 | 2022 | |||
| Salary increase | Fund | Salary increase | Fund | |
| Mean | 3.4% | 3.7% | ||
| Max | 4.3% | Greater Manchester | 4.6% | 10 Funds |
| Min | 2.1% | Sutton | 2.7% | Cornwall |
| Range | 2.2% | 1.9% | ||
The mean salary increase assumption at 2025 was lower than 2022, which largely reflects the decrease in the inflation assumption. However, more interestingly, the range for the salary increase assumption has widened slightly at 2025, suggested some funds are anticipating salaries to increase at a higher rate than inflation. For example, as can be seen above, Greater Manchester had the highest salary increase assumption at the 2025 valuation and is as a result of a 1.5% real salary increase at this valuation, compared with a 0.8% real salary increase at the 2022 valuation.
Please note that this analysis does not consider the use of promotional salary scales which have been used by some funds.
This chart shows the range of long-term salary increase assumptions used by funds at this valuation and the previous valuation:
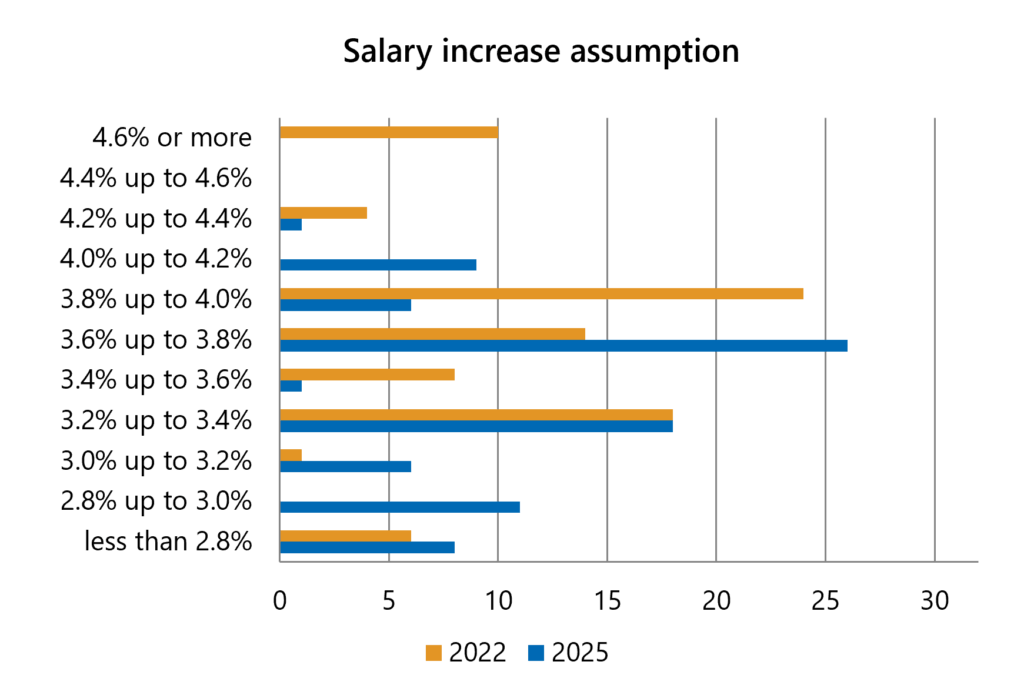
In general, the real salary increase assumption (i.e. the net salary increase assumption when inflation is removed) is an important assumption. This is because salary increases beyond inflation affect benefit accrual only, whereas inflation also impacts on revaluation of pension post-retirement. This means that analysis of real salary increases can be helpful to indicate how a funds’ liabilities are expected to grow for active members, in a different way to deferred and pensioner members. Further, real salary increases are important when calculating employer contributions. A higher real salary increase assumption will increase the amount required by employers to provision for future benefits. In contrast, a lower real salary increase assumption may improve affordability for employers, but also increases the risk of underfunding.
A table showing some statistics regarding the real salary increase assumption for the 2025 and 2022 valuations is shown below.
| 2025 | 2022 | |||
| Real Salary Increase | Fund | Real Salary Increase | Fund | |
| Mean | 1.0% | 0.9% | ||
| Max | 1.5% | 18 Funds | 1.6% | West Sussex |
| Min | -0.3% | Sutton | 0.0% | Cornwall |
| Range | 2.3% | 1.6% | ||
The reported average real salary increase (the difference between the salary increase assumption and the CPI inflation assumption) has increased slightly to 1%, although this would have little impact on the funding position. However, the range has increased and those funds using a higher real salary increase assumption will see a deterioration in their funding position.
Demographic assumptions
There are a number of demographic assumptions (also known as statistical assumptions) made as part of a valuation, such as mortality (i.e. how long members will live), rates of retirement and rates of withdrawal from active service. These are essentially estimates of the likelihood or timing of benefits and contributions being paid.
The key demographic assumption is the post-retirement mortality assumption as it influences how long each fund expects pensions to be paid for. We analyse this further in this section.
Post retirement mortality
The post-retirement mortality assumption will generally vary from fund to fund as this may take into account the specific profile of each fund and its members.
There are two aspects to consider in determining appropriate post-retirement mortality assumptions:
- choosing an appropriate mortality base table assumption applicable today taking into account characteristics of the fund members; and
- making an appropriate allowance for mortality to improve in future.
The base table (and any adjustments made to it) will generally vary between funds but the allowance for mortality to improve in the future is a more subjective assumption which will tend to be consistent between funds, although the different actuarial firms have taken different views on what this should be and which version of the CMI Model to use. The CMI model is a statistical model that looks at the future improvements in mortality rates over time. It is updated annually to take into consideration the latest data and all funds used the latest CMI model i.e. CMI 2024.
The average life expectancies assumed at age 65 as set out in the dashboard are detailed in this chart:
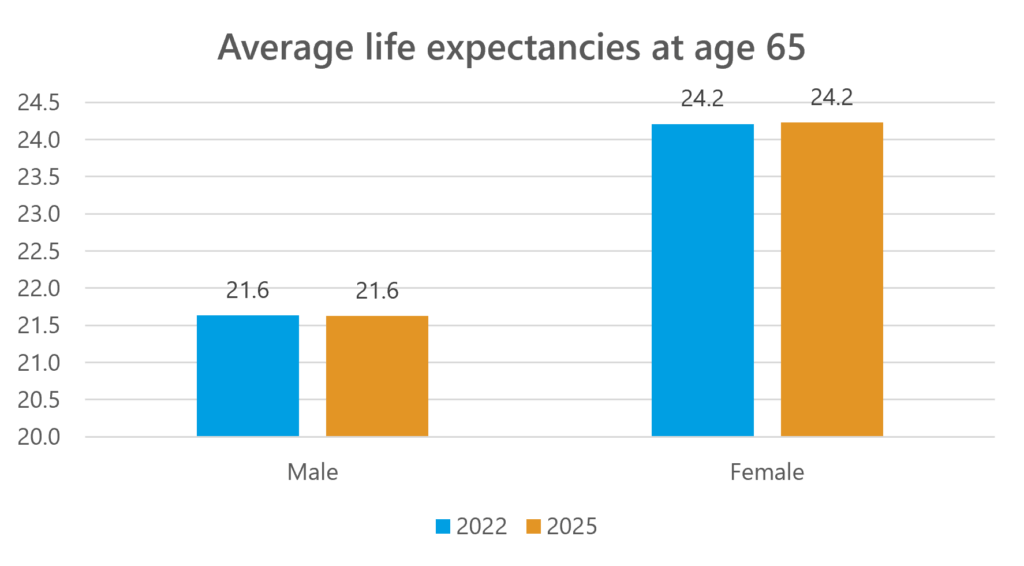
The average life expectancy assumption for males and females has stayed largely consistent between the 2022 and 2025 valuations. However, the range of life expectancies has narrowed significantly, from 3.7 to 2.0 for males and 2.7 to 2.0 for females. This perhaps reflects an increased understanding of the impact of the COVID-19 pandemic when compared to the 2022 valuation. In particular, all funds moved to the CMI 2024 model which has a different methodology for taking into account the effect of COVID-19 for future mortality improvements.
The assumptions used have resulted in a range of life expectancy assumptions across the LGPS as set out in this table:
| 2025 | 2022 | |||
| Life Expectancy at age 65 (Male) | Fund | Life Expectancy at age 65 (Male) | Fund | |
| Mean | 21.6 | 21.6 | ||
| Min | 20.6 | Greater Gwent | 19.5 | Newham |
| Max | 22.6 | Hertfordshire/Merton | 23.2 | Hampshire |
| Range | 2.0 | 3.7 | ||
| 2025 | 2022 | |||
| Life Expectancy at age 65 (Female) | Fund | Life Expectancy at age 65 (Female) | Fund | |
| Mean | 24.2 | 24.2 | ||
| Min | 23.0 | Dorset | 22.9 | Newham |
| Max | 25.0 | Oxfordshire | 25.6 | Hampshire |
| Range | 2.0 | 3.7 | ||
Funding results
Funding level
Based on the 86 fund reports analysed at both valuations, the results of the 2025 valuation reported assets of £401.7bn and liabilities on local funding assumptions of £328.8bn, i.e. a surplus of £72.9bn and a funding level of 122%. This is an overall improvement compared to the position in 2022 which showed assets of £361.1bn and liabilities of £339.0bn i.e. a surplus of £22.1bn and a funding level of 107%. Evidently assets have increased more than the liabilities since the 2022 valuation, largely due to the former discussion on the large increase in real discount rates which places a lower value on the liabilities.
This chart shows the range of funding levels at 2025 and 2022:
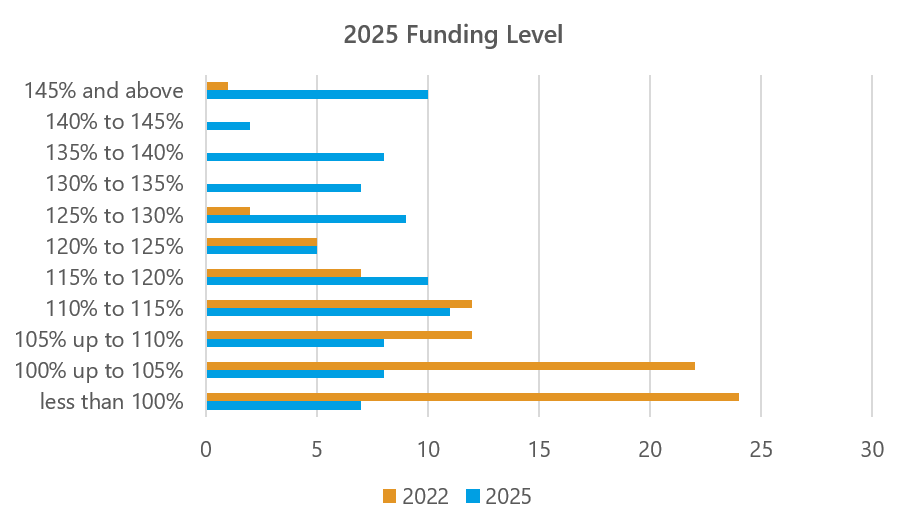
As can be seen from the chart, there has been a significant improvement in funding levels across the LGPS since the 2022 valuation. Published funding levels ranged from 86% to 175% (an improvement from the range at 2022 of 80% to 154%), with an average of 122%[1] (compared to an average of 107% at 2022). 78 funds were reported as more than fully funded (i.e. higher than 100% funding level) as at 31 March 2025 compared to 61 funds as at 31 March 2022.
[1] Simple average funding level not weighted by size of Fund.
| 2025 | 2022 | |||
| Funding level | Fund | Funding level | Fund | |
| Mean | 122% | 107% | ||
| Min | 86% | Berkshire | 80% | Havering |
| Max | 175% | RBKC | 154% | RBKC |
| Range | 89% | 74% | ||
| Max Increase | 47% | Isle of Wight | 29% | RBKC |
| Min increase | -8% | LPFA | 0% | Enfield |
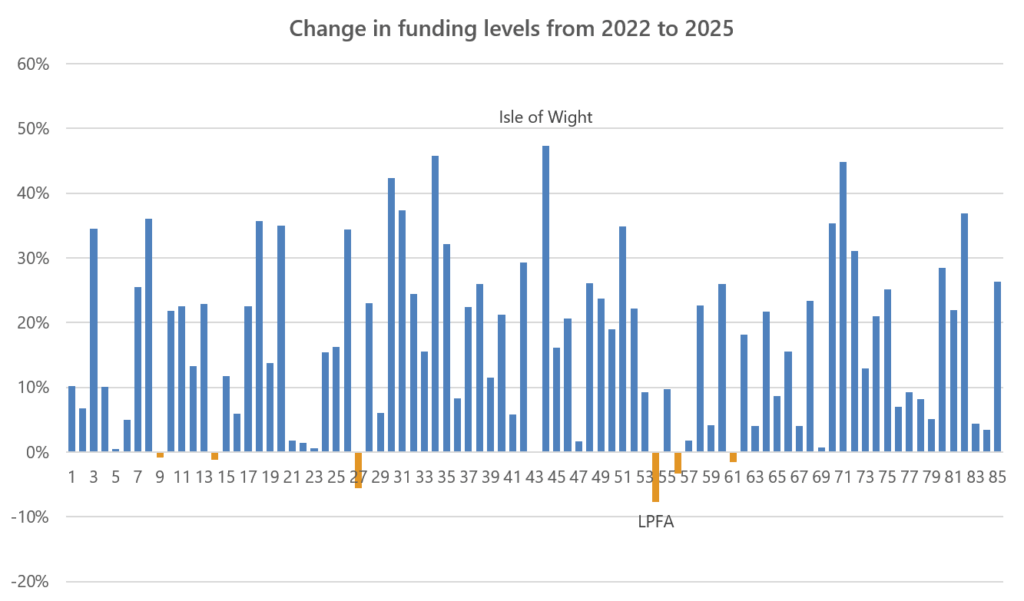
All but six funds analysed saw an improvement in funding level. The largest improvement in funding level was 47% for the Isle of Wight Pension Fund, whilst the London Pension Fund Authority (LPFA) saw the biggest drop in funding level, with an 8% decrease. The Royal Borough of Kensington and Chelsea (RBKC), as per the 2022 valuation, had the highest funding level at 175% funded, whilst Berkshire Pension Fund was the lowest funded at 86%.
The change in funding levels from the 2022 valuation to the 2025 valuation can be seen in more detail in the next chart. There are clearly a wide range of changes seen by funds between valuations. This is reflective of individual variation for funds on both the asset side (primarily due to investment returns) and on the liability side (primarily due to choice of discount rate assumption). An increase in the funding level would represent the assets growing proportionally more than the liabilities, whilst a decrease in the funding level would represent the liabilities growing proportionally more than the assets, since the last valuation.
Local funding level versus real discount rate assumption
This chart shows the range of funding levels on a local basis, against the real discount rate assumption (i.e. the margin above the CPI inflation assumption) adopted at 2025:
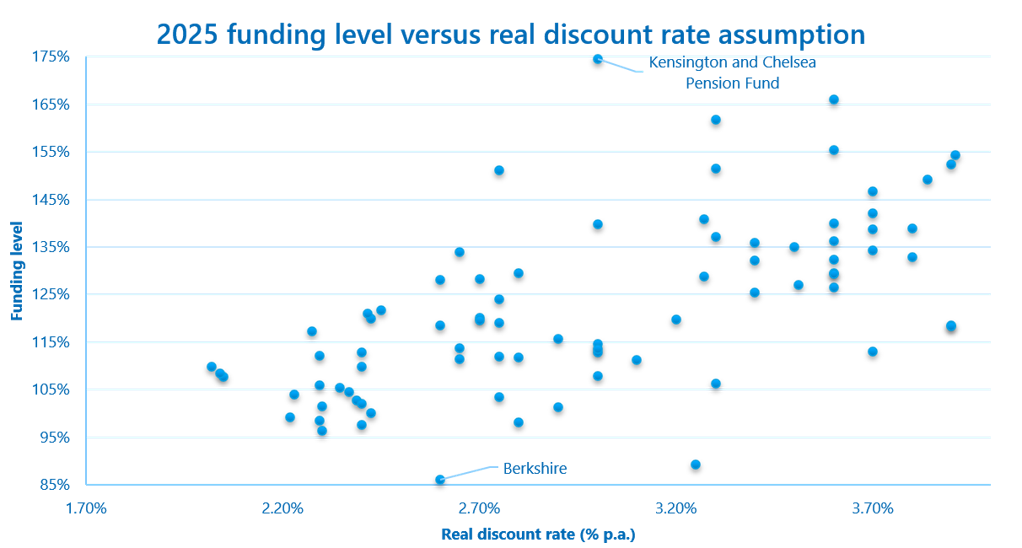
As can be seen in the chart above, there is a slight positive correlation between the real discount rate and the funding level. This is reflective of the largest change in the funding position for most funds being liability related, rather than on the asset side. Despite this, there is still a wide range of funding levels corresponding to each real discount rate. The differences in funding level will be due to a number of factors, such as the value of the fund assets and the range of investment returns achieved by the individual funds.
SAB standardised basis
It should be noted that the funding positions above are calculated using local funding assumptions which will differ by fund. Funds use different assumptions to reflect their individual circumstances and attitudes to risk. Funds were also asked to submit results on the same set of agreed assumptions to the SAB standardised basis. These assumptions were unchanged between 2022 and 2025 to aid comparison (although were updated for demographics).
The average funding level reported on the SAB basis was 111% which compares to the average reported funding level of 122% on the local funding bases. Please note that the average funding level is a simpler metric which does not take into account fund size.
| 2025 | 2022 | |||
| Funding level | Fund | Funding level | Fund | |
| Mean | 111% | 117% | ||
| Min | 79% | Waltham Forest | 83% | Berkshire |
| Max | 159% | RBKC | 164% | RBKC |
| Range | 80% | 81% | ||
| Max Increase | 5% | Bedfordshire | 20% | Swansea |
| Min increase | -24% | Cheshire | -2% | Waltham Forest |
In general, funding levels on the SAB basis have decreased between the 2022 and 2025 valuations. Where the position improved, this would largely be as a result of strong investment performance. This is in opposition to between the 2019 and 2022 valuations, where most funds saw an increase.
Further analysis is expected in the Section 13 report to be published by GAD.
Funding level on a local funding basis versus the SAB standardised basis
This chart shows the funding levels as at 31 March 2025 on both the SAB basis and local funding basis for the 85 funds analysed at both valuations:
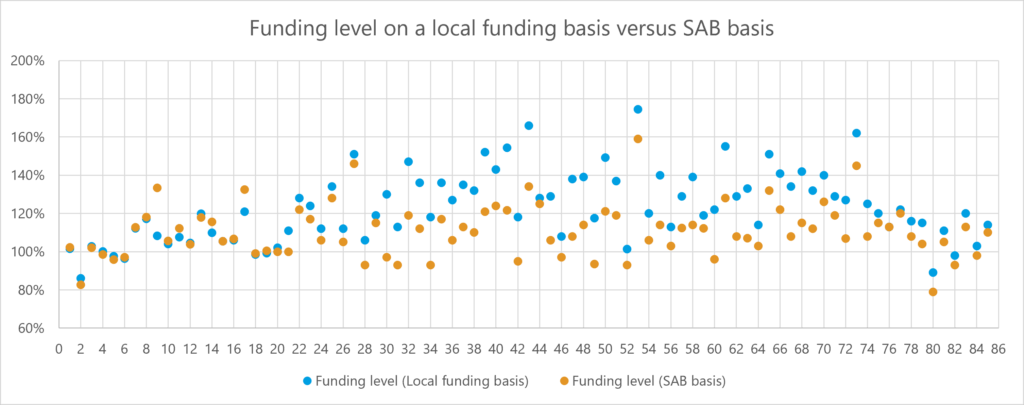
The majority of funds were worse funded on the SAB basis when compared to their local funding basis. This is in opposition to the 2022 valuation, at which the majority of funds were better funded on the SAB basis.
At the 2022 valuation, the discount rate used for the SAB basis was 4.45%. This has stayed the same for the 2025 valuation SAB basis, to allow for greater comparability between valuations. This means that the main drivers of change in funding level from the 2022 to 2025 valuation on the SAB basis are:
- On the liability side, inflation experience and the resulting high pension increases awarded over the period
- On the asset side, investment returns.
This table highlights some statistics on the change in funding level on the SAB basis from 2022 to 2025.
| Change in funding level on SAB basis | Fund | |
| Mean | 6% decrease | |
| Max deterioration | 24% decrease | Cheshire |
| Max improvement | 5% increase | Bedfordshire |
| Range | 29% |
There is currently insufficient data in the valuation reports to analyse asset returns for all LGPS funds. However, we can use the above as an indicator that funds that may have achieved particularly high, or low asset returns. Those with an increase in funding level on the SAB basis are likely to have seen strong investment performance since 2022. Caution should be taken when trying to interpret these figures as membership changes in the fund may have had a large impact on the liability side of the funding level.
Contributions
The key purpose of the 2025 actuarial valuations was to set appropriate contribution rates for each employer in the Scheme for the period from 1 April 2026 to 31 March 2029. This is required under Regulation 62 of the LGPS Regulations. Regulation 62 specifies four requirements that the actuary “must have regard to” when setting contributions and these are detailed below:
- “the desirability of maintaining as nearly constant a primary rate as possible”;
- “the current version of the administering authority’s funding strategy statement”;
- “the requirement to secure the solvency of the pension fund”; and
- “the long-term cost efficiency of the Scheme (i.e. the LGPS for England and Wales as a whole), so far as relating to the pension fund”.
The primary rate is the employer’s share of the cost of benefits accruing in each of the three years beginning 1 April 2026. In addition, each employer pays a secondary contribution as required under Regulation 62(7) that when combined with the primary rate results in the minimum total contributions certified for each employer. This secondary rate is based on their particular circumstances and so individual adjustments are made for each employer.
Primary rate of contributions
This chart shows the range of primary rates calculated at whole fund level at 2022 and 2025:
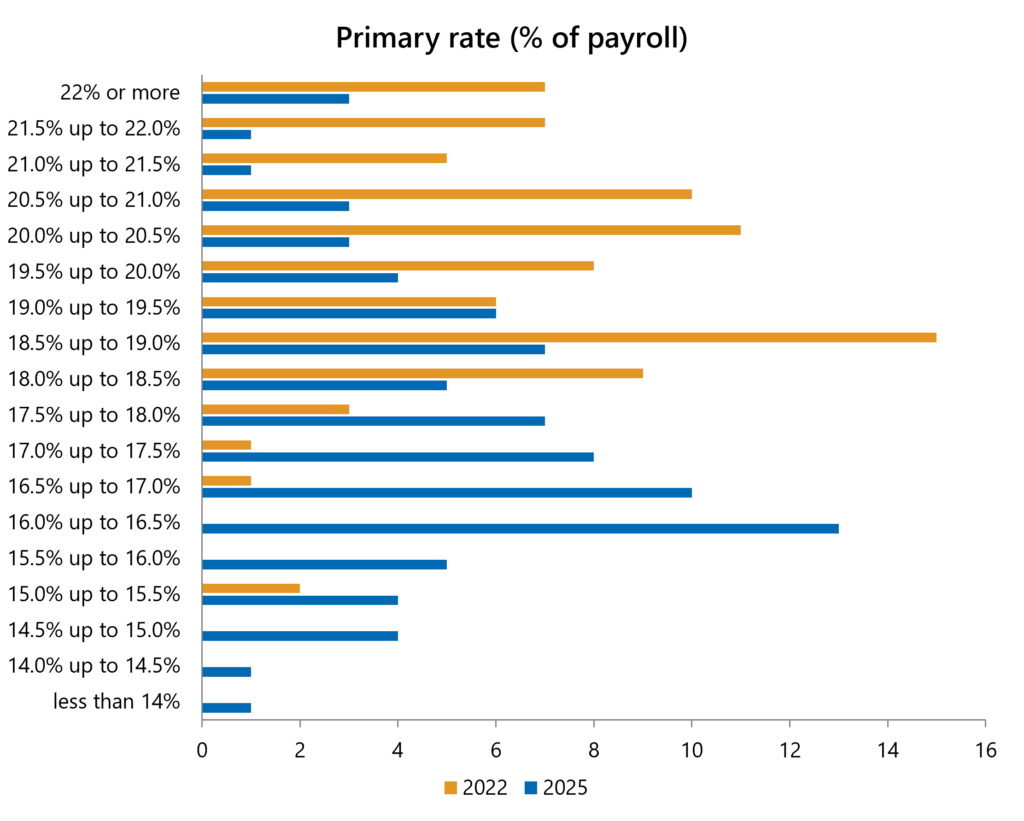
Please note that the disclosed whole fund level primary rate looks at the average rate payable by employers in the fund. It may not be paid by any individual employer.
The average primary rate decreased from 19.8% of payroll p.a. at 2022 to 17.7% of payroll p.a. at 2025. As can be seen from the chart above, there has been a general trend of decrease in primary rates.
Please note that these are the average primary rates at whole fund level; individual employer primary rates will exhibit greater variability.
This table shows some statistics on the primary rates over the recent valuations, and the change in primary rates between 2022 and 2025.
| 2025 primary rate | Fund | 2022 primary rate | Fund | Change in primary rate from 2022 to 2025 | Fund | |
| Mean | 17.7% | 19.8% | -2.2% | |||
| Max | 24.2% | Environmental Agency | 24.1% | Lincolnshire | 6.1% increase% | RBKC |
| Min | 13.9% | Durham | 15.0% | RBKC | 6.4% decrease% | Leicestershire |
| Range | 10.3% | 9.1% | 12.5% |
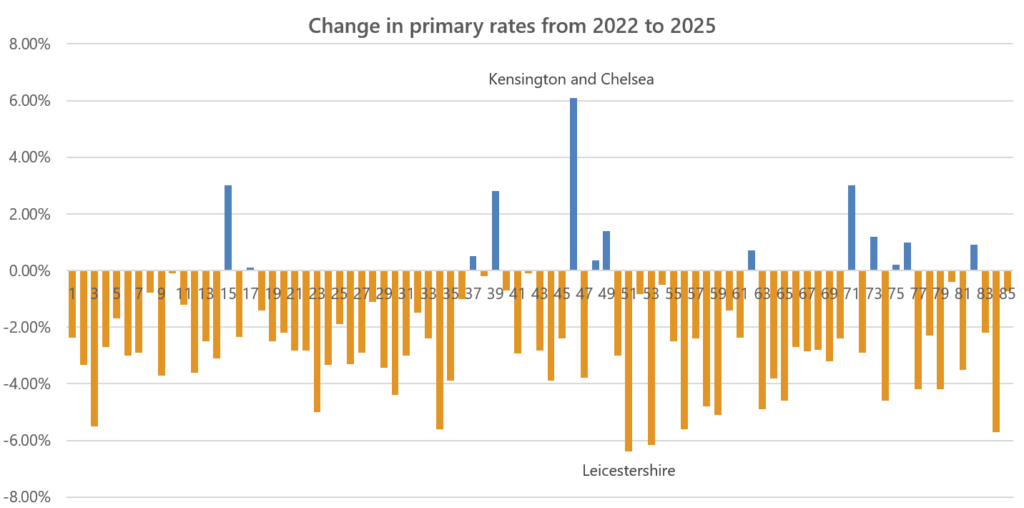
The next chart shows the changes in primary rates between 2022 and 2025. All but 12 of the Funds saw a reduction in primary contribution rates. The biggest reduction in primary rate was seen by Leicestershire (a reduction of 6.4%), whilst the Royal Borough of Kensington and Chelsea saw the largest increase in primary rate (an increase of 6.1%). It should be noted that the total contribution rate paid is an important part of the picture and therefore looking at the primary rate in isolation is potentially misleading in trying to understand the change in contribution rates. This is demonstrated in the case of Kensington and Chelsea; their primary rate is offset considerably by large negative secondary contributions, leading to the lowest total contribution rate seen at the 2025 valuation (as set out later in this section).
Secondary rate of contributions
Secondary contributions certified at the 2025 valuation have overall been negative. This represents a reduction in the total rate paid by employers when combined with the certified primary rate.
The secondary rate is the difference between the primary rate and the total contribution rate. This may be in respect of costs associated with accrued benefits or adjustments to achieve the Fund’s stability and affordability objectives. 58 of the 86 funds have reported total secondary contributions in 2026/27 as a negative amount. This could be due to the improvements in the funding levels observed and the secondary contribution rate being used to offset any increase in primary rate in order to maintain stable total contribution rates where appropriate.
More information around how the secondary rates are set for individual funds will be set out in each fund’s Funding Strategy Statement.
Some funds will set their secondary contributions as an amount to recover any deficit over a specified recovery period, or spread any surplus over a surplus spreading period. This will vary by employer and therefore it is not necessarily appropriate to consider a recovery period at fund level for a number of reasons including:
- each employer or group of employers could be given their own recovery period depending on their individual circumstances; and
- some employers are in surplus and the surplus is not allocated to other employers so may result in a misleading whole fund rate if it were assumed that it was shared.
In addition, recovery periods are used by some funds as a tool to reflect employer covenant and therefore different recovery periods are offered to different employers; this will also be set out in the Funding Strategy Statement of the relevant fund.
Based on the information set out in the valuation dashboards, there were no funds with deficit recovery periods greater than 20 years (where funds used this methodology).
Total contributions
Combining the primary rate of contributions with the secondary rate of contributions, as a percentage of payroll the average total contribution rate at whole fund level for the certified three year intervaluation period is lower at 2025 compared to 2022.
The total average contribution for the three years following the 2022 valuation was 21.5% of payroll p.a.; this has fallen to 16.5% of payroll p.a. for the three years following the 2025 valuation.
Across the analysed funds, there is significant variation in this change in average total contribution rate. It is difficult to compare accurately how the total contribution rate has changed by individual fund as there will be employers who pay up-front contributions, which will distort the figures. In addition, as, contributions are paid on an individual employer level rather than a whole fund level, and we expect even more variation at the individual employer level, individual variations will also influence the average total contribution rate.
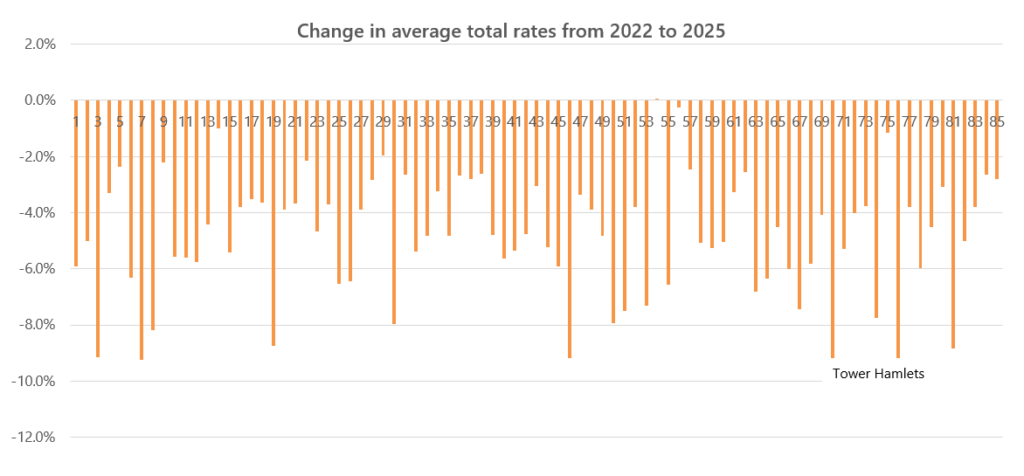
Therefore, for the purpose of this analysis, we have considered how the average total contribution rate certified over the three year period following the 2022 valuation compares to the average total contribution rate certified over the three year period following the 2025 valuation. More detail is set out in the following table and chart.
The average change in total contribution rate between 2022 and 2025 was a decrease of 4.9% of payroll, reflecting the reduction in secondary rates (due to strong asset performance helping to reduce deficits, and the improvement in funding positions) complementing the reduction in primary rates.
| 2025 R&A period average total rate | Fund | 2022 R&A period average total rate | Fund | Change in total rate from 2022 to 2025 | Fund | |
| Mean | 16.5% | 21.5% | 4.9% decrease | |||
| Max | 24.2% | Camden | 32.0% | Brent | 10.2% decrease | Tower Hamlets |
| Min | 1.3% | RBKC | 10.5% | RBKC | 0% (no change) | LPFA |
| Range | 22.9% | 21.5% | 10.2% |
Employee contributions
In addition to employer contributions, employees also contribute towards the LGPS. The contributions for each member are set with reference to salary bands which are updated annually in line with CPI inflation. The average employee contributions have marginally decreased from 6.6% of pensionable pay in 2022 to 6.5% of pensionable pay in 2025.
Tier 3 employers
Since the 2016 valuation, there has been an additional focus on understanding the potential funding, legal and administrative issues in the Scheme relating to Tier 3 employers. Tier 3 employers are largely admitted and scheduled bodies that do not benefit from local or national tax-payer backing. More information on Tier 3 employers has been set out by the SAB here. In November 2024, the Department for Education (DfE) put in place a guarantee provide assurance to LGPS pension fund managers that FE bodies should not be treated as ‘high-risk’ employers. Therefore there has been a reduction in the number of employers treated as “tier 3” at the 2025 valuation. Tier 3 employers are those without the financial backing of an external employer, and hence a more prudent approach is taken to the valuation of their liabilities. Based on the information set out in the valuation dashboards, 7% of the total liabilities as at 31 March 2025 for the 85 funds analysed were in respect of Tier 3 employers, which represents a significant decrease from 12% of the total liabilities as at 31 March 2022. We expect that this decrease is largely due to the change in categorisation of employers as described above. However, another factor impacting this decrease may have been these employers choosing to leave the fund between valuations.
Gender Pensions Gap
At the 2025 actuarial valuation, LGPS funds were required to report on the Gender Pensions Gap (GPG) for the first time. The GPG has been defined as:

The GPG (as well as the Gender Pay Gap, for which reporting was also required) is expressed as a percentage. A GPG of 20% means that, on average, females have accrued 20% less pension than males, i.e. for every £1 of pension accrued by males, females have accrued £0.80.
GPG reporting was mandated for active and pensioner members. Some funds also split this analysis by employer tier, although due to the time pressures for which the reporting was implemented on, this was not mandated and so this analysis is restricted to the GPG split on active and pensioner members. This is expected to be a necessary requirement for funds to report on at the 2028 valuation.
The large GPG figures below are an indicator of the gender equality issues in the LGPS. This is one of the aims of the access and fairness consultation currently ongoing. Included mitigations are making short periods of authorised unpaid leave automatically pensionable, and updating definitions of child-related leave to better reflect modern working patterns.
This table also indicates some statistics on the GPG for the main pension types.
| Gender Pensions Gap | Mean | Maximum | Minimum | ||
| Mean CARE pension (post 2014) | 30% | 55% (Bexley) | 16% (Lambeth) | ||
| Mean final salary pension (pre 2014) | 40% | 63% (Bromley) | 12% (City of London Corporation) | ||
| Mean total pension | 34% | 45% (Cornwall/Havering) | 16% (Ealing/Lambeth) | ||
As seen in the table, there was a very wide range of GPG values reported.
This chart shows the range of GPG figures shown by funds at the valuation, for mean final salary pension (i.e. pre 2014 pension), mean CARE pension and mean total pension.
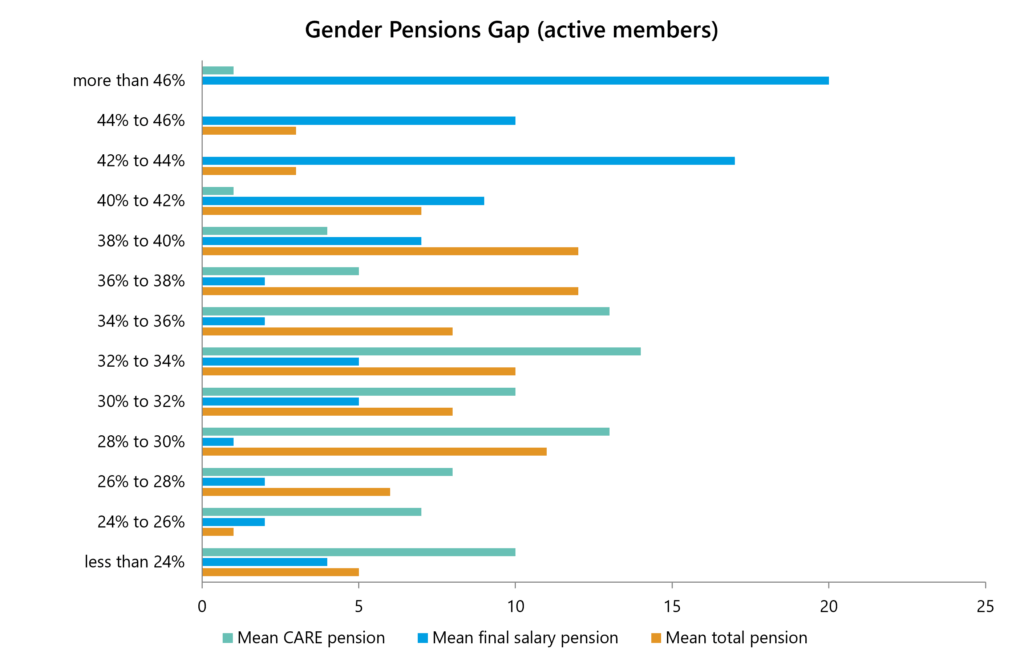
There were no funds with a negative GPG, i.e. based on mean pension values, men always accrued more pension than women. On average, based on mean total pension (inclusive of CARE and pre 2014 benefits, for every £1 of pension accrued by males, females accrued £0.66. In other words, the average GPG for total pension was 34%.
CARE pension GPG
As seen in the earlier table, the mean GPG for CARE pension is smaller than the final salary pension at 30% compared to 40%. This is likely as a result of the change in benefit structure. CARE is arguably fairer to lower earners and/or those with lower salary progression. One of the reasons for moving to a CARE scheme in the first place was around fairness, so moving to a CARE scheme looks to have helped close the GPG. In addition, employers may have made other efforts to close the GPG.
Gender pay gap
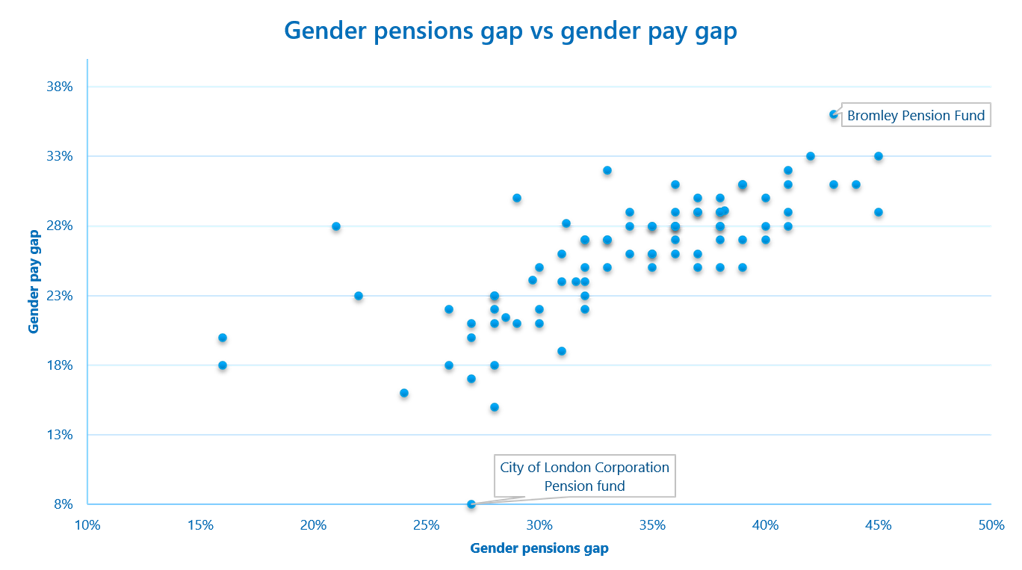
The GPG for a fund is closely related to the gender pay gap, i.e. the equivalent metric for pay, as opposed to pensions. Particularly, given that pre 2014 pension benefits in the LGPS are based on final salary, there is a direct link between pay and pension for members with these benefits. This can be seen in the chart below, with GPG for mean total pension plotted against gender pay gap for actual pensionable pay for active members.
Not all fund data may be completely accurate, given the appearance of some outliers in the graph. In general, however, it is likely that funds lying below the line of best fit (i.e. those with a relatively gender pension gap compared to their gender pay gap) are those with younger membership whose pensions are less related to final salary benefits. On the other hand, those funds lying above the line of best fit are likely those with older membership who have proportionally more final salary benefits due to an older membership.
Furthermore, the table below shows some statistics for the gender pay gap, for both members’ full time equivalent pay (FTE) and their actual pensionable pay. There is clearly a large difference between these metrics. This is likely due to more female members being part time, and more female member having unpaid leave time in relation to childcare. These inequalities are aiming to be addressed in part by the access and fairness consultation as mentioned at the start of this report.
| Gender Pay Gap | Mean | Maximum | Minimum | |
| Mean full time equivalent pay | 14% | 26% | 3% | |
| Mean actual pensionable pay | 26% | 36% | 8% | |
Please contact the Scheme Advisory Board secretariat for further information on the results of this research.
| Avon | East Sussex | Lewisham | Waltham Forest |
| Barking and Dagenham | Enfield | Lincolnshire | Wandsworth |
| Barnet | Environment Agency Active Fund | London Pensions Fund Authority | Warwickshire |
| Bedfordshire | Essex | Merseyside | West Midlands |
| Berkshire | Gloucestershire | Merton | West Sussex |
| Bexley | Greater Gwent (Torfaen) | Newham | West Yorkshire |
| Brent | Greater Manchester | Norfolk | Wiltshire |
| Bromley | Greenwich | North Yorkshire | Worcestershire |
| Buckinghamshire | Gwynedd | Northamptonshire | |
| Cambridgeshire | Hackney | Nottinghamshire | |
| Camden | Hammersmith and Fulham | Oxfordshire | |
| Cardiff and Vale of Glamorgan | Hampshire | Powys | |
| Cheshire | Haringey | Redbridge | |
| City of London Corporation | Harrow | Rhondda Cynon Taf | |
| City of Westminster | Havering | Shropshire | |
| Clwyd | Hertfordshire | Somerset | |
| Cornwall | Hillingdon | South Yorkshire | |
| Croydon | Hounslow | Southwark | |
| Cumbria | Isle of Wight | Staffordshire | |
| Derbyshire | Islington | Suffolk | |
| Devon | Kensington and Chelsea | Surrey | |
| Dorset | Kent | Sutton | |
| Durham | Kingston upon Thames | Swansea | |
| Dyfed | Lambeth | Teesside | |
| Ealing | Lancashire | Tower Hamlets | |
| East Riding | Leicestershire | Tyne and Wear |
Was this page helpful?